Organizing Analytics Chaos
Opening Keynote The conference opening keynote was themed “Achieving Clarity in a World of Ambiguity”. Well, that feels familiar. Trying to deliver data and analytics… Read More »Organizing Analytics Chaos
Opening Keynote The conference opening keynote was themed “Achieving Clarity in a World of Ambiguity”. Well, that feels familiar. Trying to deliver data and analytics… Read More »Organizing Analytics Chaos
Welcome to part 5 of my Spotfire Data Limiting Series. The first post in the series covered data limiting with the filter and data panels. The second post talked about data limiting in the web player. The third post discussed limiting using filtering schemes. Last week, I covered limiting with marking. Now, we are on to limiting with expressions. As a new Spotfire user, I was enamored with filtering schemes, but as my skills developed, limiting with marking became my go-to method.
Read More »Data Limiting With Expressions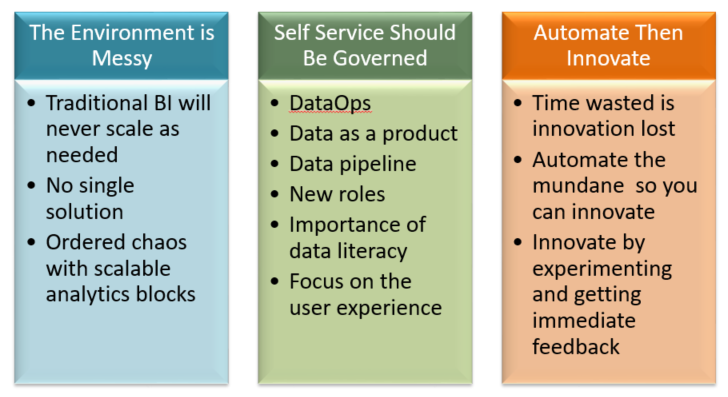
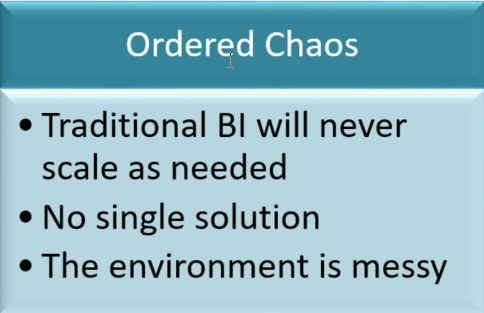
Last week, I attended the Gartner Analytics conference in Orlando. It was my first time attending a Gartner event. Granted, I have previously read their research. The scale of the event impressive. The speakers were top-notch, and the content was relevant to the challenges I deal with every day. To summarize the most important things learned, I developed 3 key messages from Gartner. They contextualize the 7 presentations I attended into important themes important for analytics at any company. Read on if…

This week, I was working on a Spotfire project with integrated filtering and marking using relations. I’m having some issues with this functionality. As part of my troubleshooting, I wanted to confirm all wells existed in both related tables. I was able to compare data in tables using lists very easily. Read more to find out how.
Read More »Compare Data in Tables Using Lists
Welcome to part 4 of my Spotfire Data Limiting Series. The first post in the series covered data limiting with the filter and data panels. The second post talked about data limiting in the web player. The third post discussed limiting using filtering schemes. Now, we are on to limiting with marking, which many people know as creating details visualizations. This is one of my favorite features of Spotfire, and it’s one of the application’s many interactive features.
Read More »Data Limiting with Marking
A Spotfire user reached out to me on LinkedIn last week asking about developing Spotfire skills. He wanted to know what skills to focus on and how to develop them. I have LOTS of ideas and thoughts on this. Therefore, this week’s post looks at building Spotfire skills based on roles in the oil and gas industry.
Read More »Developing Spotfire Skills
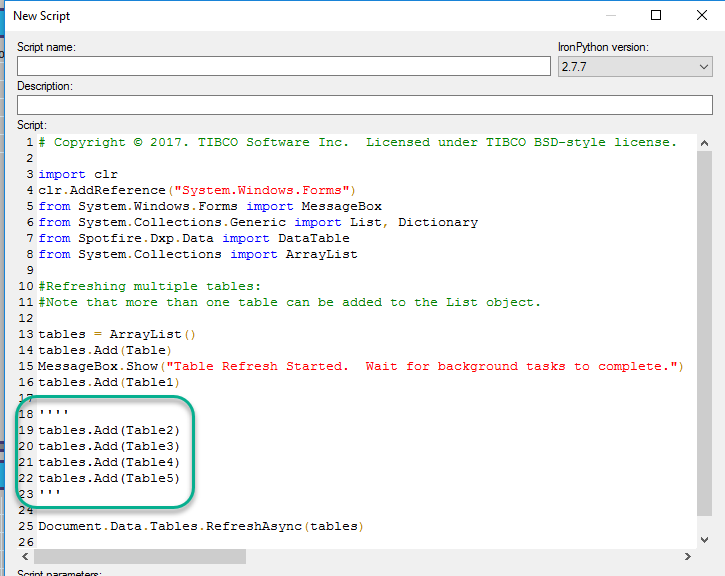
I’m familiar with commenting out code using the hashtag symbol “#”, which is used here. The hashtag works well enough for commenting out single lines… Read More »Comment Out Multiple Lines of IronPython

When I originally conceptualized the series on data limiting, I incorporated the web player at the end. I thought that by the end, I would have explained all the different methods of data limiting and would conclude with how those methods are limited in the web player.
I’m only one part in, and I realize data limiting in the web player needs to come before everything else. Each post explains when to use a particular method, and quite often you use (or don’t use) a method BECAUSE you are working in the web player. So, I am reordering things a little bit. Part 8 is now Part 2!
Read More »Data Limiting in the Web Player
Modules, packages, and repositories are three terms that often cause confusion for analysts as they leave BI tools behind and begin to write their own code. I’ll reference these terms in many future posts, and you’ll continue seeing them throughout your career. We’ll cover the basics of each and go over a few examples in Python and R.
Read More »Modules, packages, and repositories. Oh my!