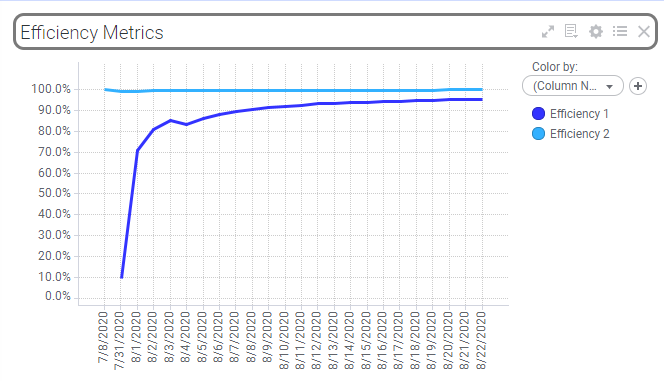
Limiting Data When Columns Change
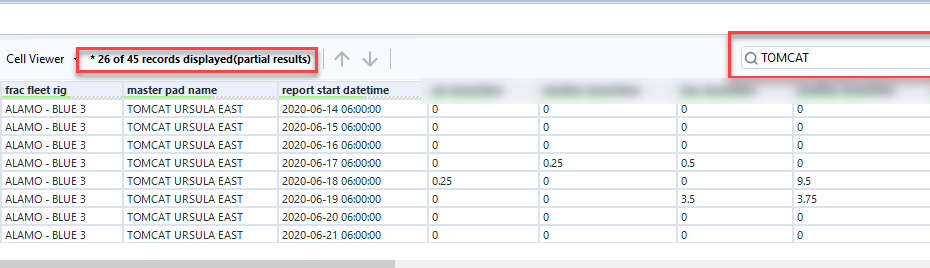
This week I worked with one of our engineers on a Spotfire project where he needed to filter out nulls and zeros from his visualizations. This should be easy, but users set the y-axis columns using a property control. Basic data limiting by expression was impossible because the columns kept changing. Limiting data when columns change is challenging but not impossible. There are two ways to do it. Read on to learn more.
Read More »Limiting Data When Columns Change