If you’ve been following along, you know that my series on learning the Spotfire expression language is something of a long haul. It turns out that explaining Axis Names is a long and detailed affair. I am committed to it, and so this week I’m going thru axis names for line charts. If you missed it, check out Axis Names on Bar Charts.
Blog or Video
Axis Names for Line Charts
With that said, here are examples of how to use the 3 axis names available to line charts.
Axis.X
Axis.X refers to the column of data on the x-axis of the bar chart. This data can be a date hierarchy, a categorical column of data, or a categorical hierarchy. The expression below calculates a cumulative sum. The way to interpret this expression is — Calculate the current node (current month) by summing oil for all previous nodes (months). If the x-axis was setup with quarters, it would calculate a cumulative sum by quarter, which makes this expression very dynamic. You can change what’s on the x-axis without modifying the expression.
Expression: Sum([OIL]) over (AllPrevious([Axis.X]))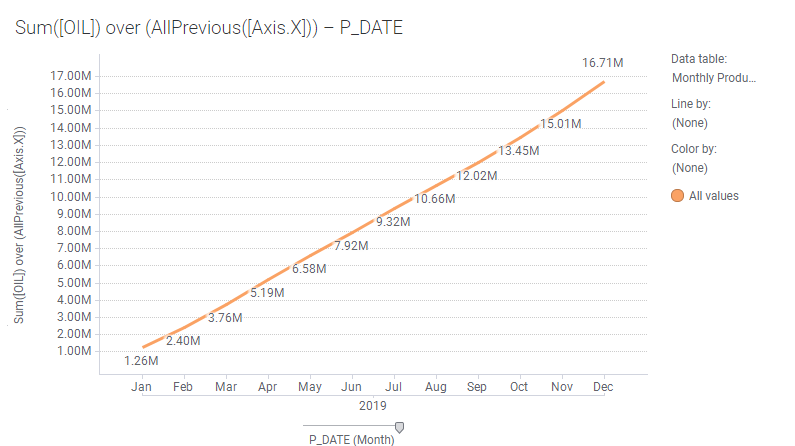
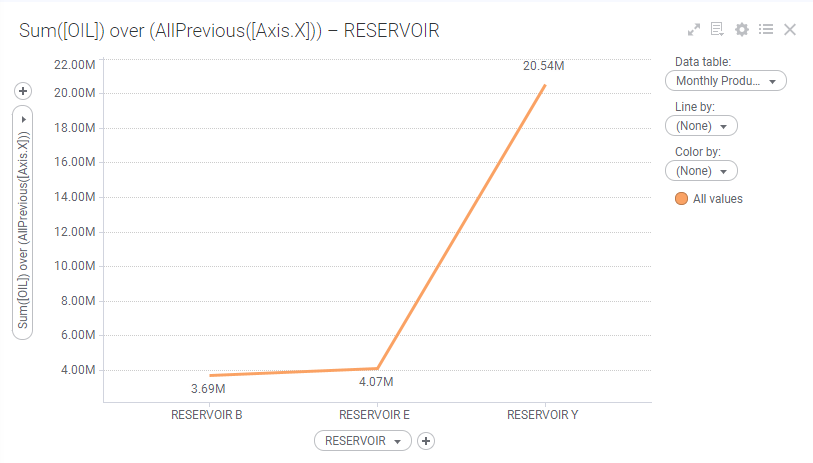
If I change the column on the x-axis to a categorical column of data, the expression will still calculate relative to the order of values on the x-axis. This cumulative sum assumes Reservoir B comes first, Reservoir E second, and Reservoir Y third.
Axis.Line
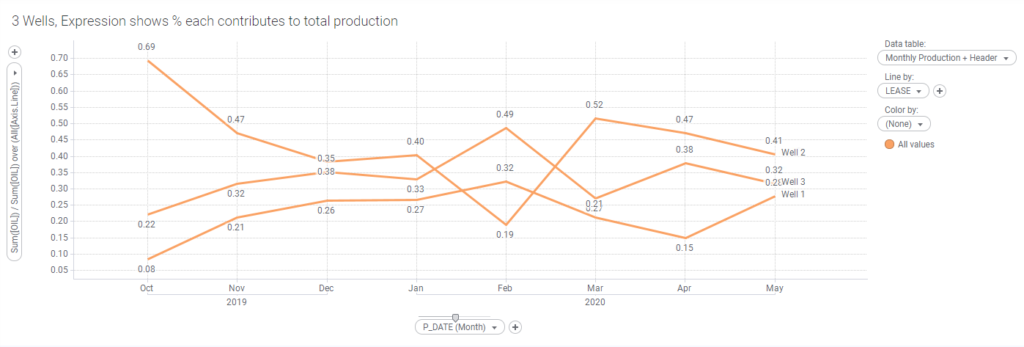
Axis.Line references the column of data applied to the Line by variable. In the examples below, I am showing a line for each LEASE, and I have filtered to 3 leases.
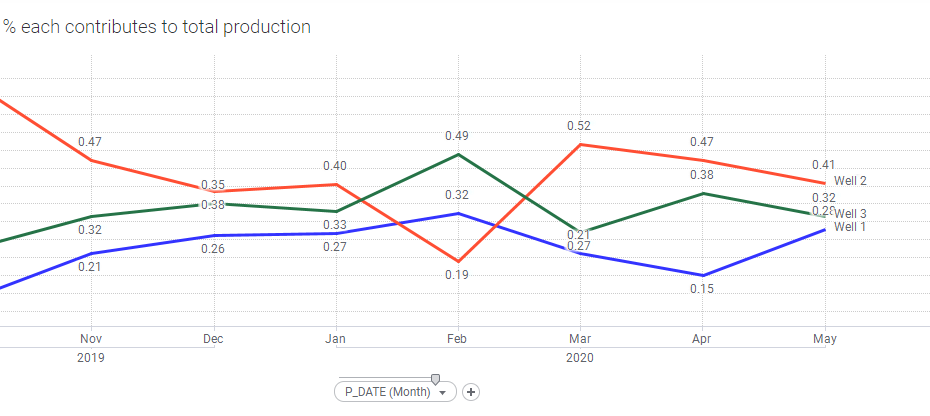
The way to interpret this expression is — sum oil for each node (month) and well (as indicated by Line by LEASE). Divide that value by the sum of oil for all lines (or all LEASES). This calculates the percentage that each lease contributes to the total for the month.
Expression: Expression: Sum([OIL]) / Sum([OIL]) over (All([Axis.Line]))
Now, what if you want each line to have a different color? I’ll get to that with Axis.Color, discussed below. First, let’s look at another use of Axis.Line.
In the visualization below, the blue lines represent the average oil production for 3 leases. The yellow line is the average oil for all lines or leases. The expression can be interpreted as — Calculate the average oil for all lines.
Expression: Avg([OIL]) over (All([Axis.Line]))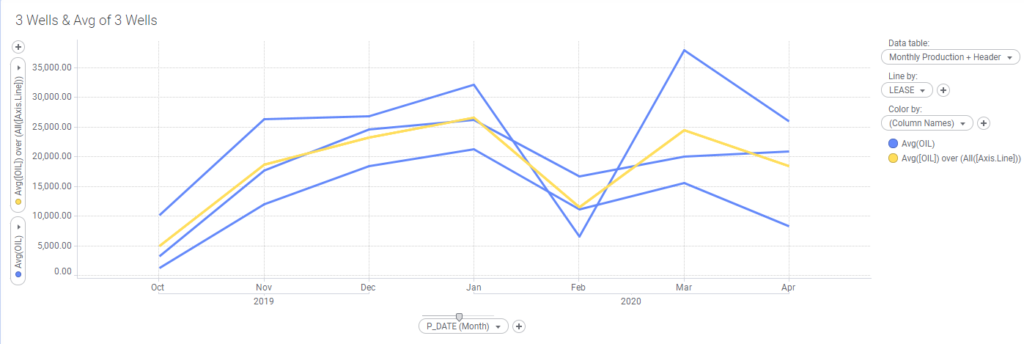
Now, as I worked thru visualization examples after I created the chart above, I wanted to modify it so that each lease had its own color. Unfortunately, that is not possible. When my own attempts at this failed, I reached out to TIBCO support who informed me this was as good as it gets. But let’s take a look at how we can add more color to one of the previous examples.
Axis.Color
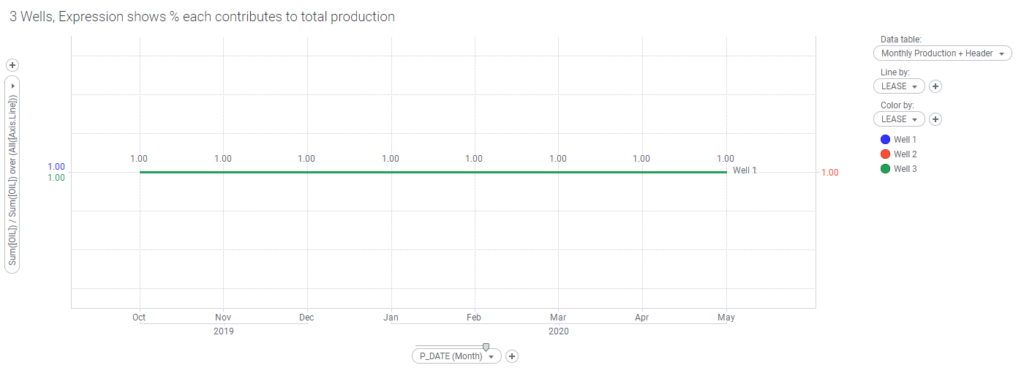
The visualization shown below is a bit dull. I’d like to give each line a different color. The most intuitive way to accomplish this is to add LEASE to the color by variable. But, you’ll find out this does not work….
Adding LEASE to the Color by selector results in 3 lines that sit on top of each other with a value of 1 or 100%. This change gives the wrong result because Spotfire uses color in the expression without expressly referencing it. I explained this in the Axis Names for Bar Charts post. The same thing happens in bar charts.
Instead, you must change the expression to reference Axis.Color and also remove LEASE from the Line by selector. Just modifying the expression will not generate the right result.
Expression: Sum([OIL]) / Sum([OIL]) over (All([Axis.Color]))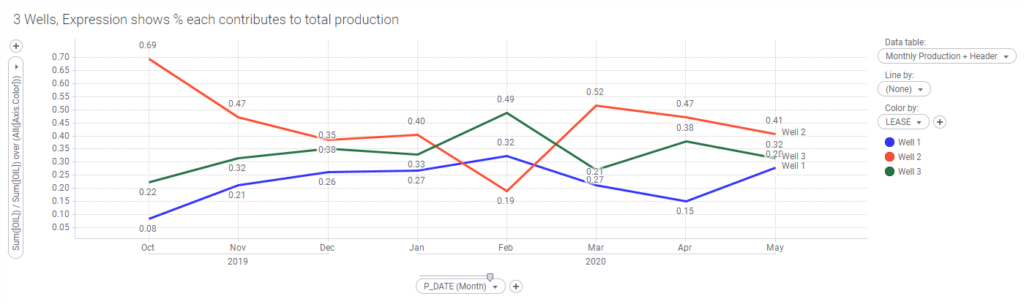
Reminder
And that explains how to use axis names in Spotfire line charts. Next, I’ll look at cross tables.
Spotfire Version
Content created with Spotfire 10.3.
Pingback: How to Improve Spotfire Load Times » The Analytics Corner
Pingback: Calculate the Last Value on a Visualization » The Analytics Corner
Pingback: Spotfire Prompts to Install Over and Over » The Analytics Corner
Pingback: The Danger of Hiding Data in Spotfire » The Analytics Corner