Spotfire’s label functionality leaves a lot to be desired. You can turn on all labels, which will probably clutter the chart since you can’t move labels on most charts. Or, you can mark data points to see select labels. None of this is helpful if you want specific labels on an exported report, which is where I found myself last week. To get around Spotfire limitations and still fulfill my customer requirements, I opted to add a text area with a calculated value above my visualization. This allowed me to calculate the last value from a visualization without dealing with labels. My calculation was cumulative, so I expected that if I used the same calculation, the end result would be the last value on my visualization. It was not. Even TIBCO support was stumped as to why this didn’t work. Read on to learn a little bit more about calculated values and the Spotfire expression language.
My Use Case
Here is the visualization I was working with last week. It shows 2 different efficiency metrics. My users want to be able to see the value of the metrics on the last day.
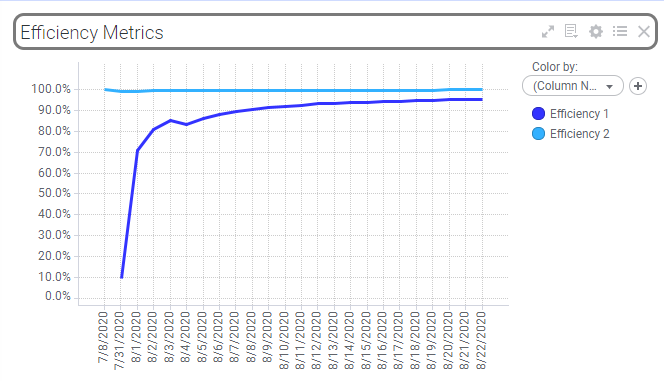
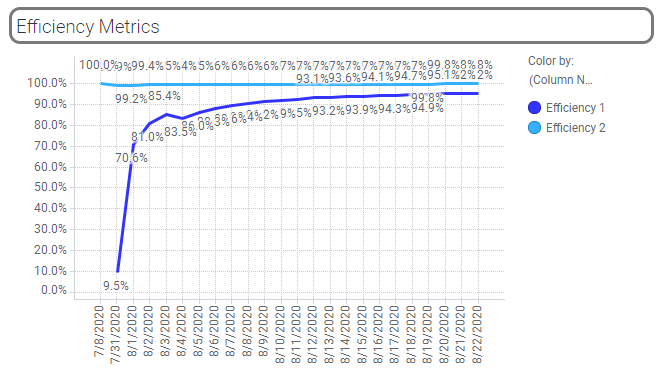
Let’s all agree that turning on all labels looks like garbage. Yes, okay. Furthermore, I can’t turn on labels with marking because this chart goes out in a PDF package that is emailed to users. If you know of a way to mark a specific data point before exporting a report, please let me know!
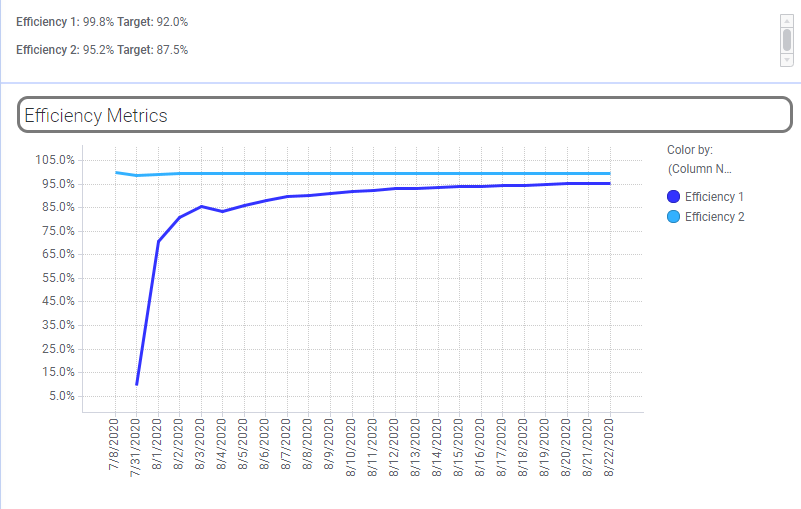
So, the only way to work around it was to add a text area above the visualization with a calculated value that would show the value of the last day.
The Expressions
As you can see, both of my expressions, use the “Axis.X” Axis Name. For more on Axis Names in line charts, check out this post. You’ll also notice that the expression is cumulative. I use the AllPrevious node navigation method. Therefore, I expected that putting the same expression into a calculated value would give me the last value (after substituting the name of the column on the x-axis for Axis.X). It did not, and I can’t clearly articulate why it didn’t. I just know that it didn’t. I also have a solution.
Efficiency 1
Sum([hours]) over (AllPrevious([Axis.X])) / (Sum([hours]) over (AllPrevious([Axis.X])) + Sum([Value1]) over (AllPrevious([Axis.X]))) Efficiency 2
(Sum([hours]) over (AllPrevious([Axis.X])) - Sum([Value1]) over (AllPrevious([Axis.X])) - Sum([Value2]) over (AllPrevious([Axis.X])) - Sum([Value3]) over (AllPrevious([Axis.X])) - Sum([Value4]) over (AllPrevious([Axis.X]))) / (Sum([hours]) over (AllPrevious([Axis.X])) - Sum([Value3]) over (AllPrevious([Axis.X]))) Calculated Value
To get the right result from the calculated value, I needed to do two things.
- Swap Axis.X with the column that is actually on my visualization, which in this case is the “report end date”.
- Wrap the “Last” aggregation method around the entire expression.
Last(Sum([hours]) over (AllPrevious([report end date])) / (Sum([hours]) over (AllPrevious([report end date])) + Sum([Value1]) over (AllPrevious([report end date]))))
Last((Sum([hours]) over (AllPrevious([report end date])) – Sum([Value1]) over (AllPrevious([report end date])) – Sum([Value2]) over (AllPrevious([report end date])) – Sum([Value3]) over (AllPrevious([report end date])) – Sum([Value4]) over (AllPrevious([report end date]))) / (Sum([hours]) over (AllPrevious([report end date])) – Sum([Value3]) over (AllPrevious([report end date]))))
With this modification, the expression returns the last value of the entire expression. I often forget that you can nest expressions and aggregation methods. Now, I know how to calculate the last value from a visualization.
Spotfire Version
Content created with Spotfire 10.3.