I recently kicked off a series on learning how to use the Spotfire expression language. The first post explained different ways to create calculations in Spotfire. Next week, I’ll release a post on how to use the over keyword. Axis names are a more advanced topic, which technically puts it a bit “out of order”. But, axis names are what inspired me to write the series, and I know that if I don’t write about something when I am working it, I often never get to it. Thus, I am going to show you how to use axis names in Spotfire cross tables.
My Use Case
Right now, I am working on a project to replace an enormous Excel macro with a much simpler Spotfire project. The macro is making comparisons of last month’s data to the current month’s data and highlighting when they are different. In Spotfire, I will use a cross table for this task, but before I go there, let me show you the orientation of my data.
The Data Set
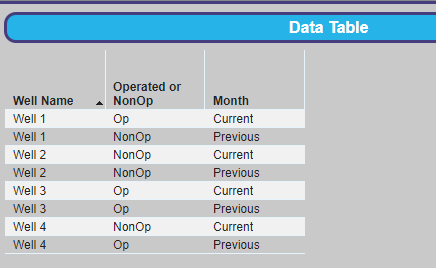
Now, I am using a simple dummy data set to test out my calculations. I have intentionally organized my data in this way because I know I will need a column of data to separate the current month from the previous month in the cross table. I very briefly considered keeping the current and previous month data in separate tables but quickly abandoned that idea for the simplicity of one table.
The End Result
This is my desired end result. I have a text area with a drop-down property control allowing the user to choose which column of data to inspect. Right now, we are only looking at one column of data — Operated or NonOp — but I will add more. There are two cross tables. The bottom cross table is configured to only show what’s different.
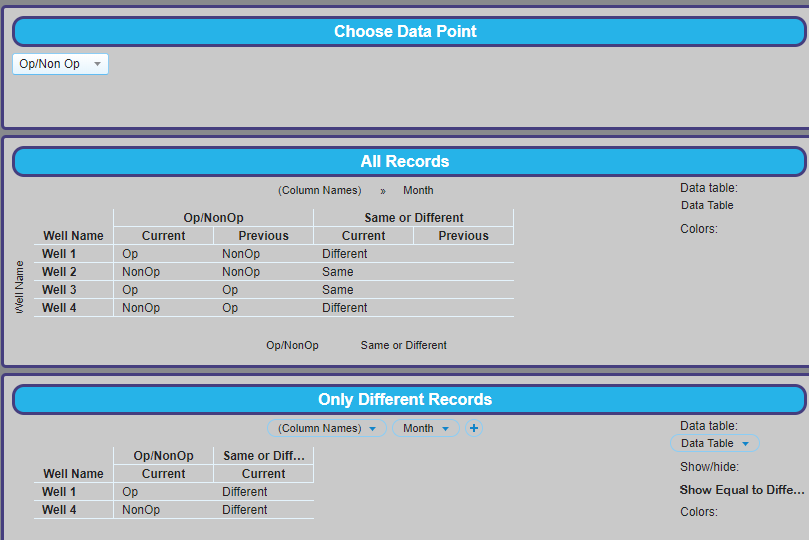
For this use case, it is much more efficient to write one expression on the axis of the visualization than several into the data table.
Cross Table Config
Horizontal Axis (Categorical Axis) = Well Name
Z-Axis (also Categorical Axis) = (Column Names) and Month
Any time you want to use more than one measure, you must add (Column Names) to the Z-Axis of the cross table. Adding Months allows slicing and dicing by the values in the Months column.
Measure 1 = UniqueConcatenate([Operated or NonOp]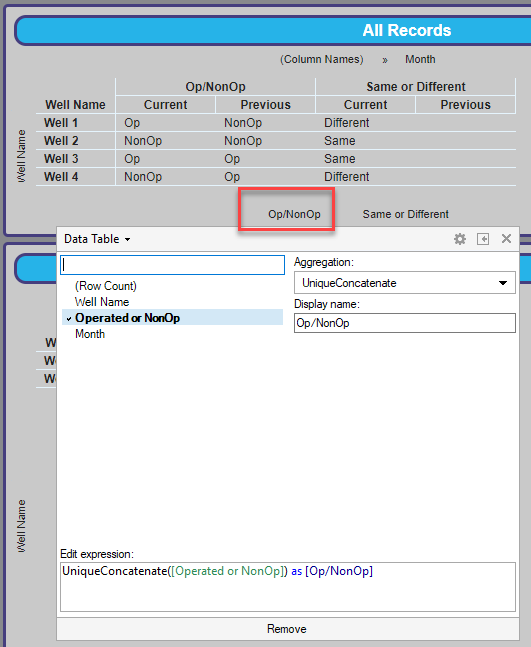
Measure 2 = if(UniqueConcatenate([Operated or NonOp])<>UniqueConcatenate([Operated or NonOp]) over (Next([Axis.Columns])),"Different","Same") as [Same or Different]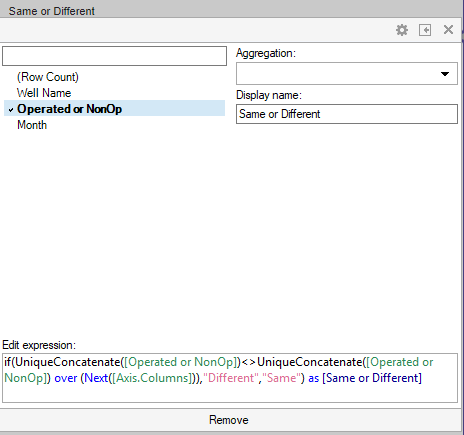
This expression is a simple if statement that looks at the value of a cell and compares it to the value of the cell in the next column. If the values aren’t equal, return “Different”, else “Same”.
Custom Expression Explained
In my opinion, the difficulty in working with axis names is understanding that you are working from a relative position. To explain, the first part of the expression will uniquely concatenate each cell.
UniqueConcatenate([Operated or NonOp])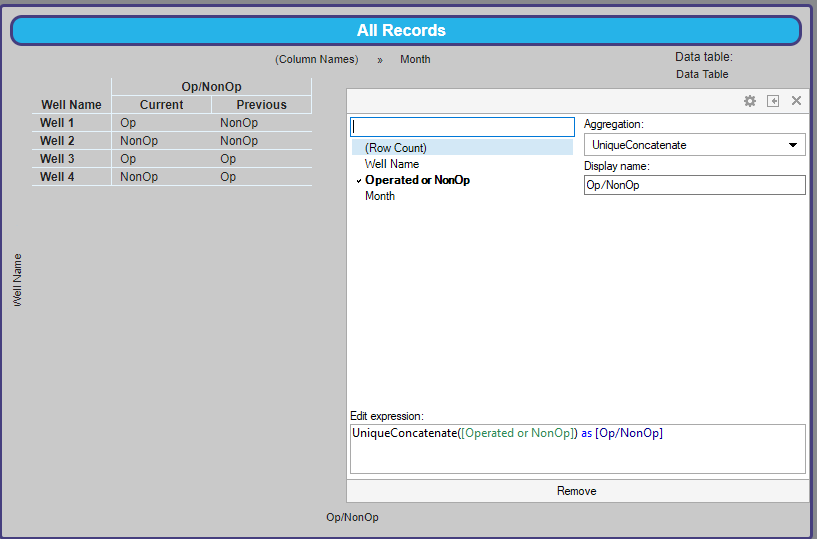
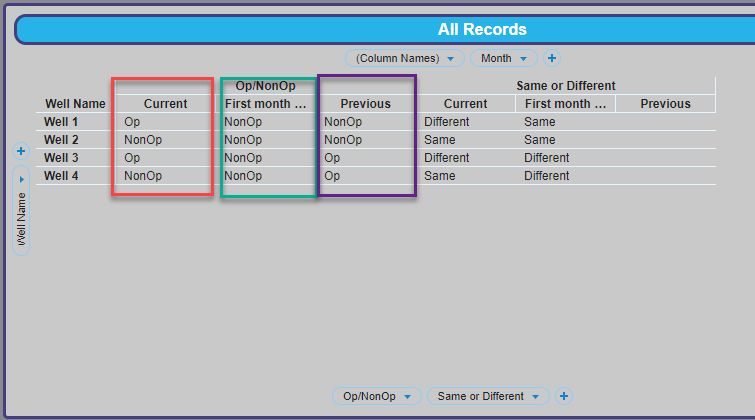
Then, based on the second part of the expression, it will compare that to the cell in the next column (because I used the Next node navigation method).
To make sure this is clear, I modified my data set to include a third month called “First Month of Year”. The Same or Different section of the cross table first compares Current to First Month of the Year and then First Month of the Year to Previous. What’s being compared is based on relative position. The last column in the table is blank because there is nothing to the right of Previous to compare it to.
Now, this might still be confusing if you aren’t familiar with the over keyword or node navigation (i.e. Next). However, don’t worry, those posts are coming soon.
Wrap Up
Lastly, most visualizations have more than one axis name available for use. For a full list, check out the TIBCO documentation.
I hope this post on how to use axis names in Spotfire cross tables helps you get your feet wet using axis names. They are incredibly useful. Because I am using axis names, I can create one dynamic chart rather than several calculated columns.
Spotfire Version
Content created with Spotfire 10.2.
Pingback: Using the Then Keyword » The Analytics Corner
Pingback: Use the Over Keyword to Slice and Dice Spotfire Calculations » The Analytics Corner
Pingback: Node Navigation - All, Next, Previous, AllNext & AllPrevious » The Analytics Corner
Pingback: Spotfire Errors Querying Two MS Access Tables » The Analytics Corner
Pingback: Node Navigation - Parent & ParallelPeriod » The Analytics Corner
Pingback: Master NavigatePeriod Node Navigation » The Analytics Corner
Pingback: Node Navigation - FirstNode, LastNode, LastPeriods, PreviousPeriod & NextPeriod » The Analytics Corner