This is post 7 in my series on how to learn the Spotfire expression language. In my node navigation post, I explained what a node is, what node navigation is used for, and provided examples. But, I didn’t provide explanations or examples for each method. Now, I will fill that gap by explaining the details of All, Next, Previous, AllNext & AllPrevious. Others to follow.
In my very first post in this series, I explained that there are 2 ways to write expressions in Spotfire. You can write them into a data table or you can write a custom expression on the axis of a visualization. For a long time, I was under the impression that some node navigation methods could only be used with custom expressions written on the axis of a visualization. But, that is not true. It’s just a bit tricky. I’ll show you as we walk thru examples.
This post will walk thru 5 node navigation methods. I’ll show each one in a calculated column and a custom expression so you can see the difference. For simplicity, all examples will use a bar chart. As a friendly reminder, calculated columns always use the entire data set. This is distinctly different from custom expressions written on the axis of a visualization, which incorporates filtering. Let’s take a look.
The Data Set
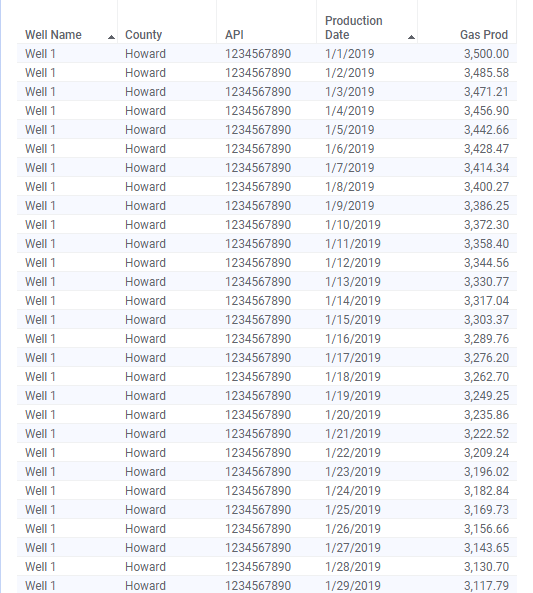
Examples are drawn from a fictitious data set containing production data for 5 gas wells from 1/1/2019 to 3/31/2019. I generally try to keep data sets small or short so it’s easy to follow along, but I will need to create a date hierarchy, so I have included 3 months of data. The API column is a unique identifier for each well.
Let’s begin with the All node navigation method.
All
From the TIBCO documentation: The All node navigation method uses all the nodes in the referenced hierarchy. If you need a reminder of what a node is, check out this post. Let’s look at some examples.
Example 1
Calculation objective: add up all gas production
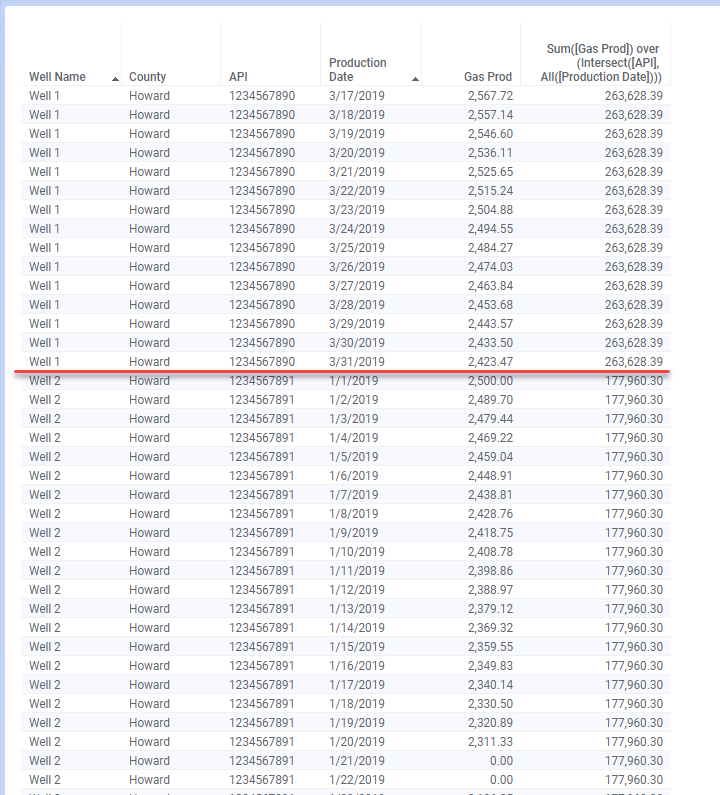
Calculated column: Sum([Gas Prod]) over All([Production Date])
Custom expression: Sum([Gas Prod]) over (All([Axis.X]))
The result of the calculated column is one repeating value for the entire data set. This is because we have told the calculation to use all production dates.
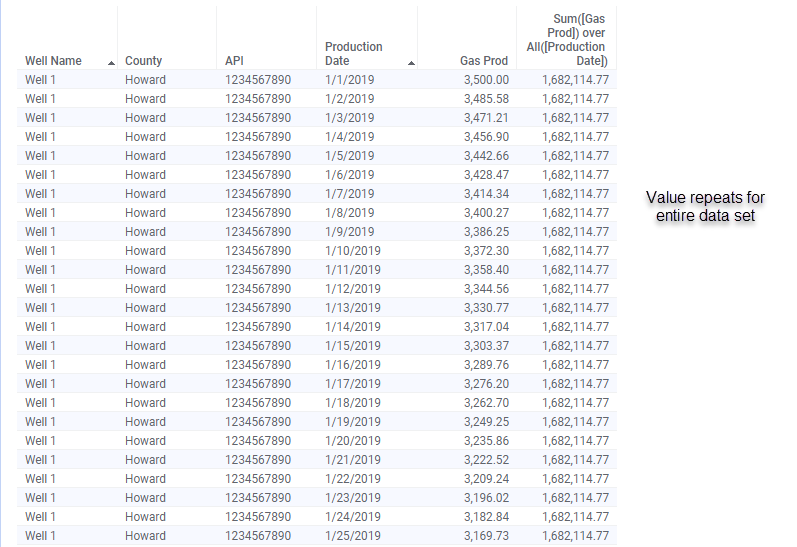
Caveat: If you are familiar with Spotfire expressions, you’ll quickly realize this expression produces the same result as Sum([Gas Prod]), which is much easier and faster to write. You would also get the same result if you used the expression Sum([Gas Prod]) over All([API]) instead of Sum([Gas Prod]) over All([Production Date]). Both calculations are using all data. That means this isn’t a great real-world example, but it does show you how the node navigation method works.
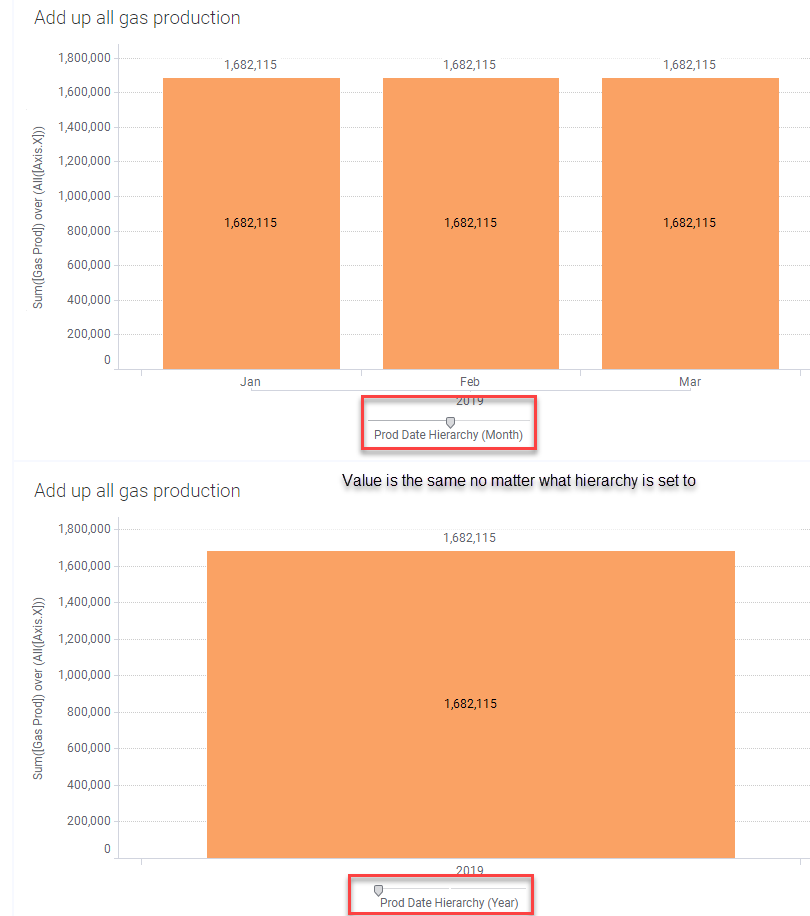
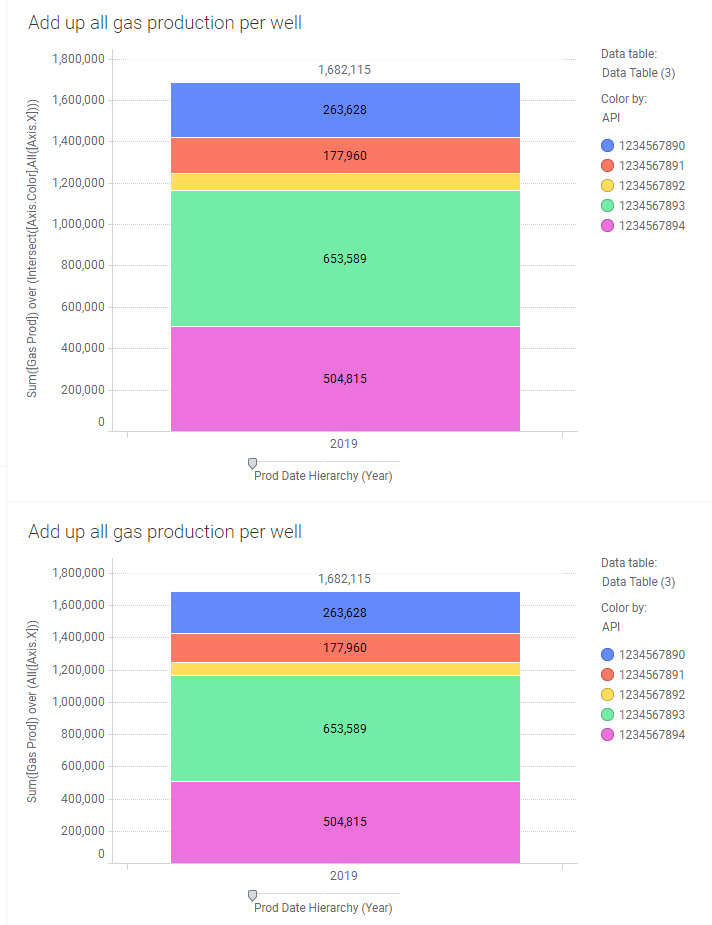
Now let’s look at the custom expression on a visualization. The difference between the syntax for the calculated column and the custom expression is the use of Axis Names. The Axis Name, [Axis.X] refers to the column of data (or in this case, the hierarchy) on the x-axis of the visualization. Now, what you’ll notice about the expression below is that no matter what I have my hierarchy set to (ex. Year, Month, Day), the value doesn’t change. That is because the expression says to use all of the data.
Working with Hierarchies
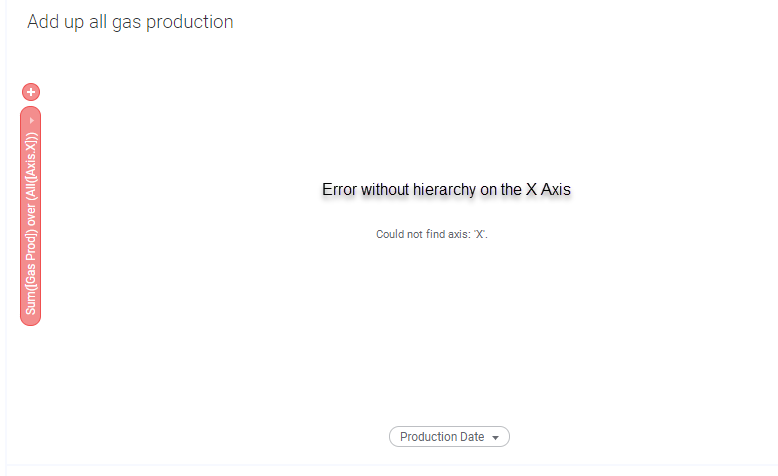
Now, you might be wondering whether a hierarchy is really necessary. The answer is yes. Spotfire will throw this error if I put the Production Date column rather than the Prod Date Hierarchy on the visualization.
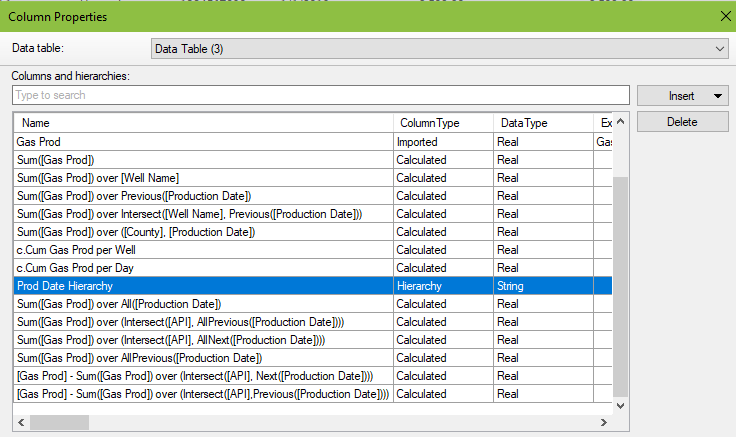
Okay, that explains you must have a hierarchy when using a custom expression on a visualization. But what about the other way around? Can we use the hierarchy column in our calculated column? Here, you can see my hierarchy column in Column Properties.
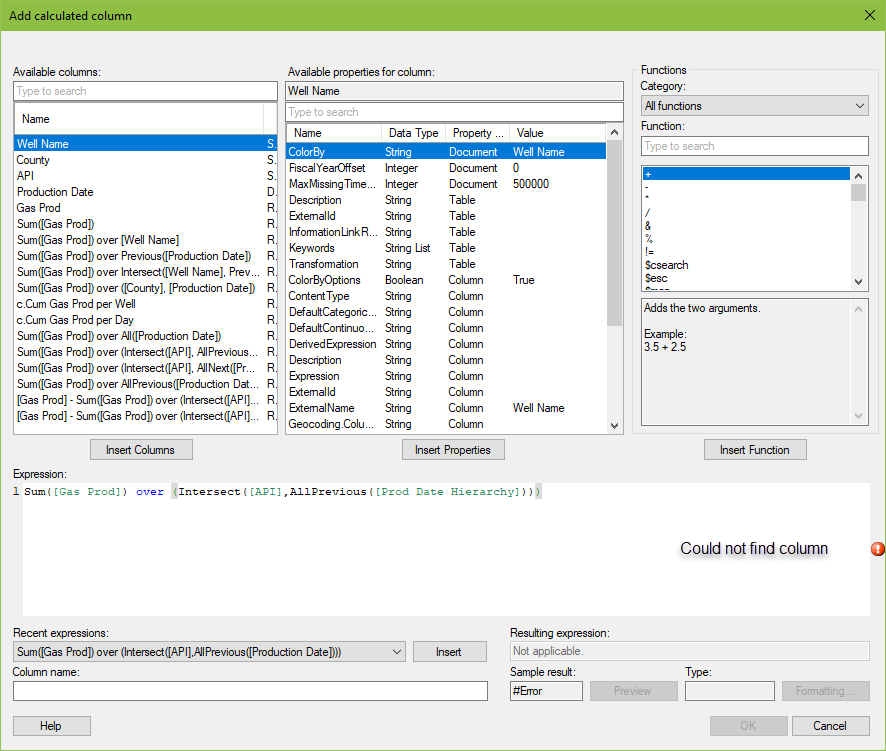
And when I use it in a calculation, the Prod Date Hierarchy column is recognized (because it’s green). However, the calculation throws an error and doesn’t allow me to click Ok.
The trick to making this work properly is a different syntax for calling the hierarchy as shown below.
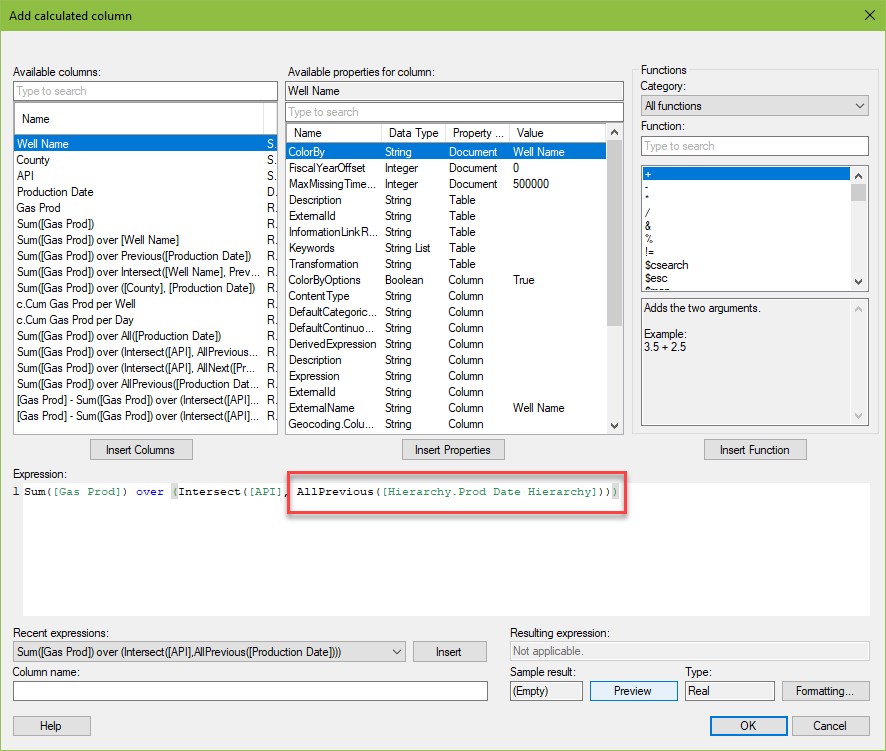
And here you cans ee the result in the calculated column is the same as using the Production Date column.
Let’s do one more example with All, adding a bit of complexity.
Example 2
Calculation objective: add up all gas production for each well
Calculated column: Sum([Gas Prod]) over (Intersect([API], All([Production Date])))
Custom expression: Sum([Gas Prod]) over (All([Axis.X])) or Sum([Gas Prod]) over (Intersect([Axis.Color],All([Axis.X])))
The result of the calculated column still has repeating values, but the value changes for each well.
Again, because the expression uses the All method, the hierarchy can be set to Year, Month, or Day and the result will be the same.
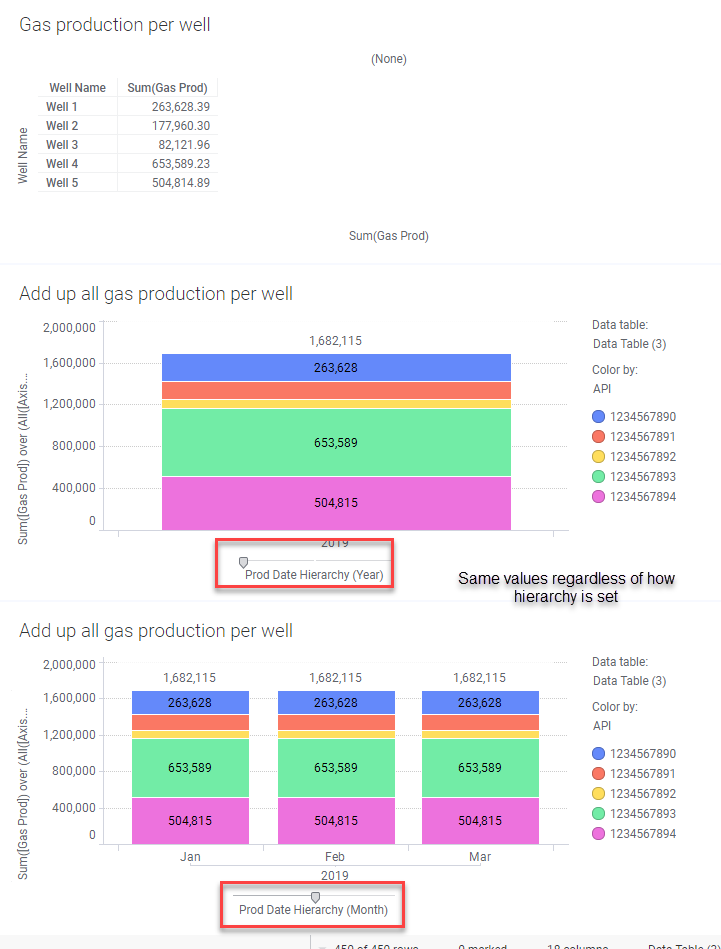
I also wanted to show you that the expression could be written slightly differently and still get the same result. On the bottom visualization, I only used [Axis.X], but because the Color by was set to API, the expression showed you gas production for each API. I could have added an Intersect([Axis.Color] to the expression to specify that I wanted the total for each API.
To be honest, I don’t think I have ever used the All node navigation method. I’ve always needed more detail, not less. But, now you know what it does and how it works. It is also a simple introduction to the other methods, which are much more useful.
Previous & Next
Previous from the TIBCO documentation: Uses the previous node on the same level as the current node to compare the result of the current node with the previous one.
Next from the TIBCO documentation: Compares the current node with the next node on the same level in the hierarchy.
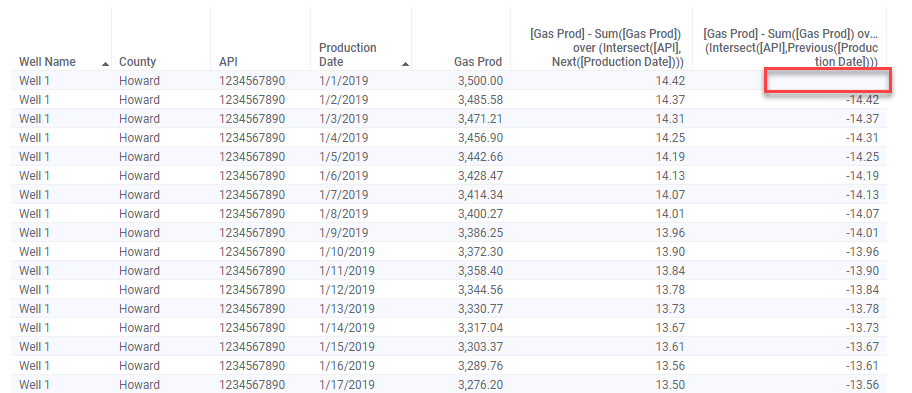
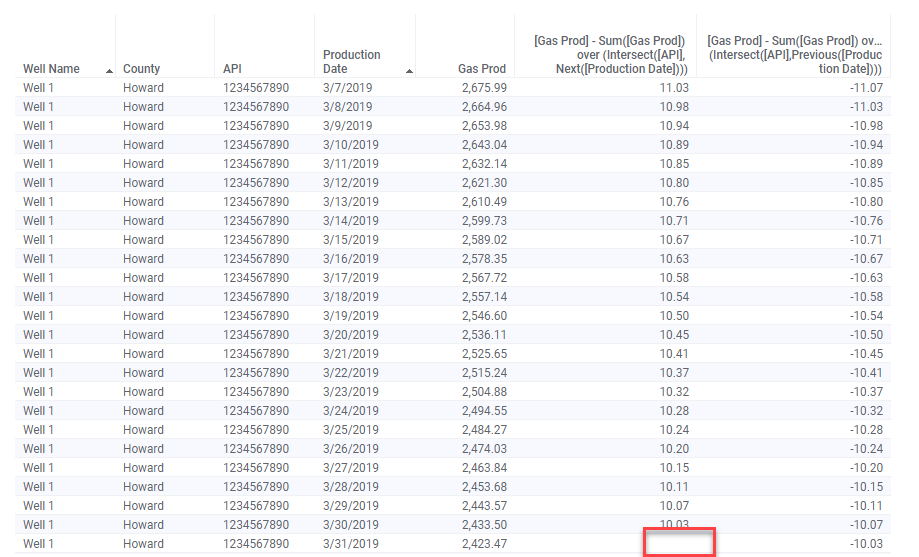
Calculation objective: for each well, calculate the difference between the current record’s gas production and the previous/next day’s gas production
Calculated column: [Gas Prod] - Sum([Gas Prod]) over (Intersect([API], Previous([Production Date])))
Calculated column: [Gas Prod] - Sum([Gas Prod]) over (Intersect([API], Next([Production Date])))
Custom Expression: Sum([Gas Prod]) - Sum([Gas Prod]) over (Previous([Axis.X]))
Custom Expression: Sum([Gas Prod]) - Sum([Gas Prod]) over (Next([Axis.X]))
Previous and Next work the same way. They just go in different directions. The first screenshot below is “top-down” (starting on 1/1). The second is “bottom-up”. You’ll notice a null value in the “first” record when using Previous and a null value in the “last” record when using Next because there is not a “previous” or “next” record to use, so the result is null.
Here is the same example when using a custom expression. I have filtered down to Well 1 for the first 5 days of January for simplicity.
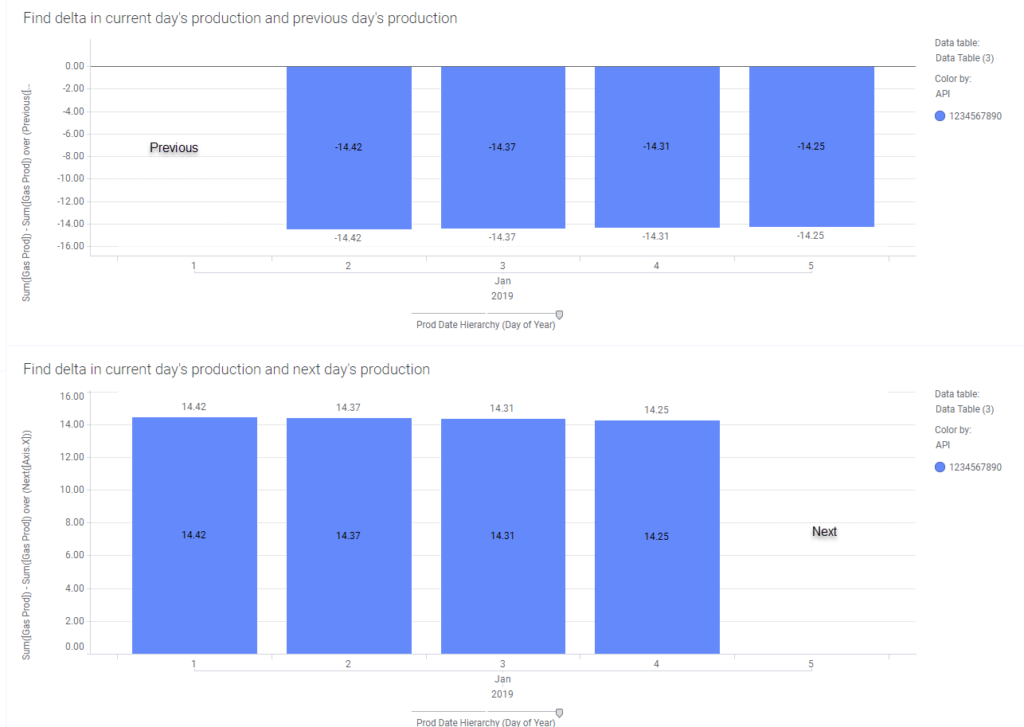
Note: Sorting does not matter when using node navigation methods. Spotfire will look at the data type and “organize” the calculation according to the data type. In this example, we are working with a date column. Spotfire decides what is next based on the fact that the column is a date and Jan 2 comes after Jan 1.
AllPrevious & AllNext
Given what we have just learned about All, Previous, and Next, I bet you can guess how AllPrevious and AllNext work.
AllPrevious from the TIBCO documentation: Uses all nodes, including the current, from the start of the level.
AllNext from the TIBCO documentation: Uses all nodes, including the current, to the end of the level.
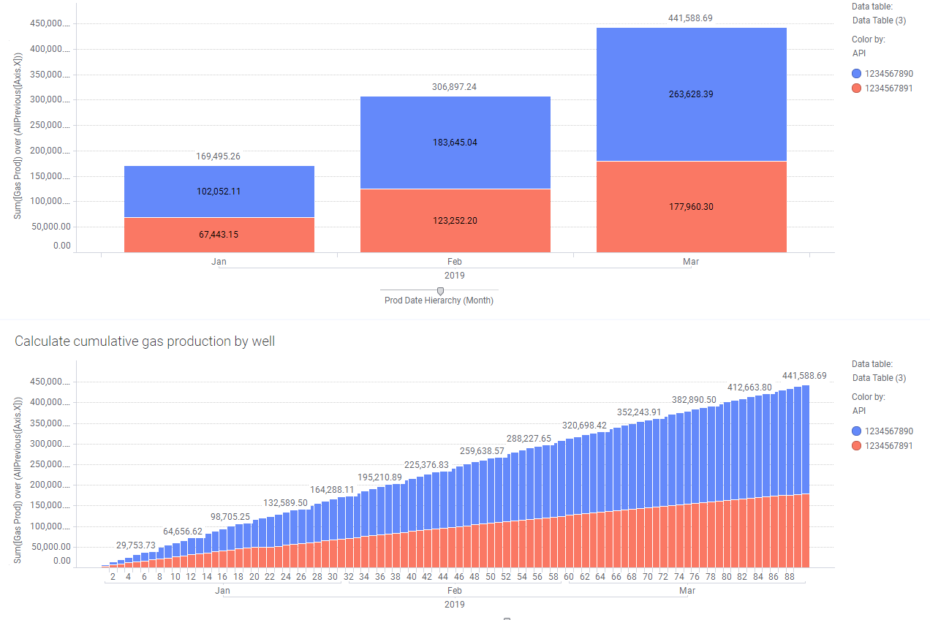
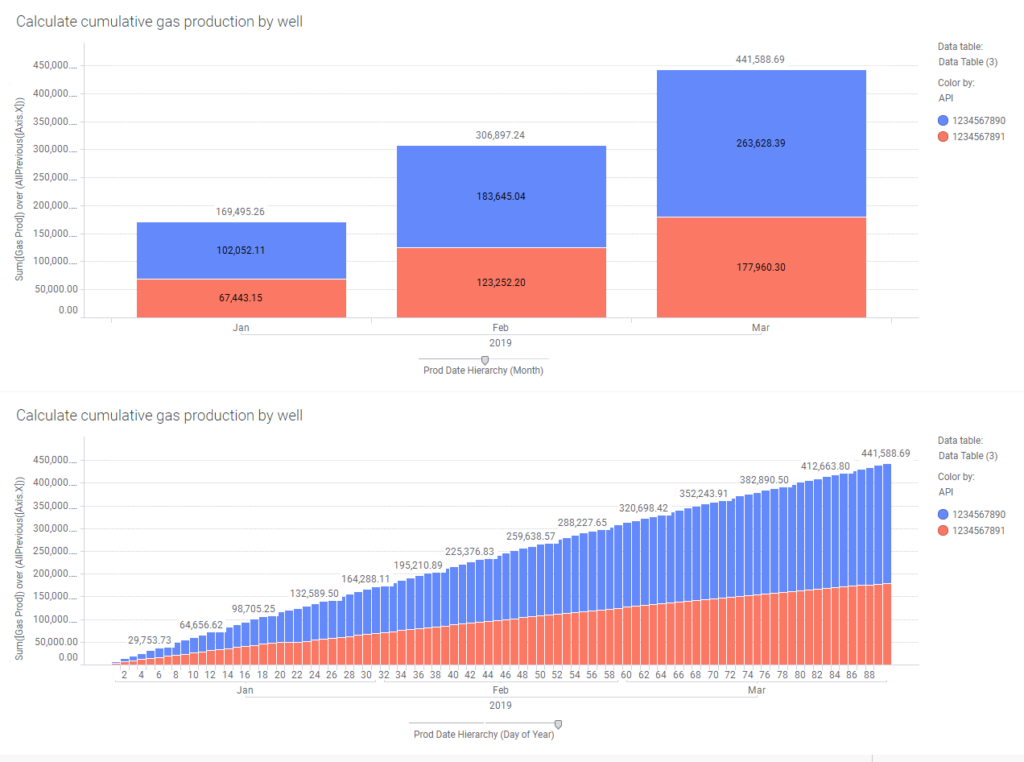
AllPrevious is perfect for creating cumulative production calculations, so…
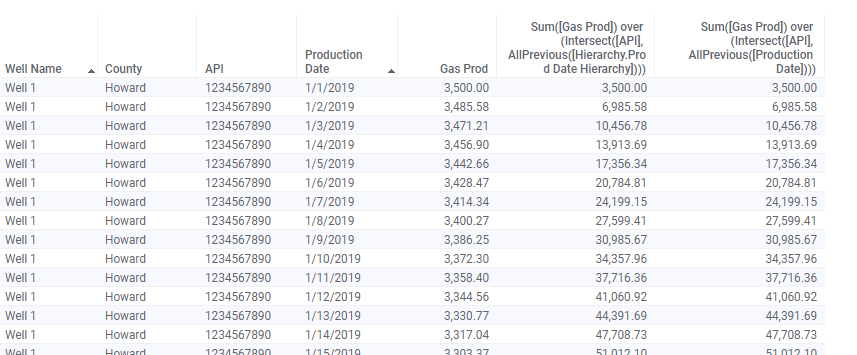
Calculation objective: calculate the cumulative gas production, day by day, for each well
Caclulated column: Sum([Gas Prod]) over (intersect([API], AllPrevious([Production Date])))
Custom expression: Sum([Gas Prod]) over AllPrevious([Axis.X])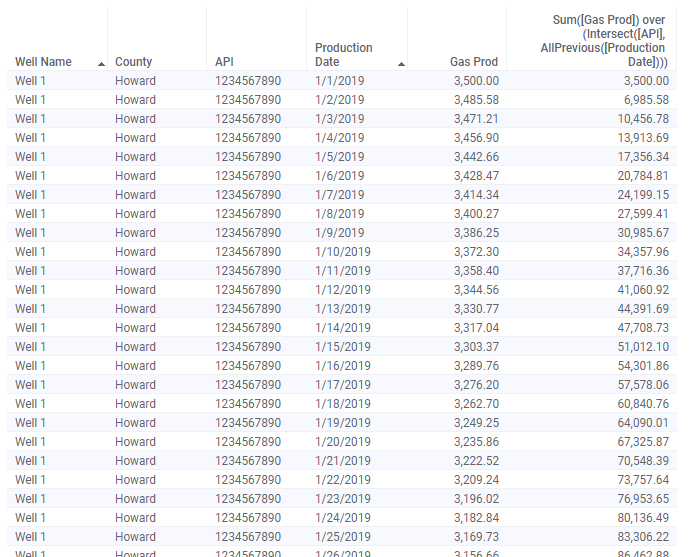
This is really where writing expressions on visualizations start to come in handy. Not only will the expression respond to filtering, but you can change the hierarchy, and the calculation will update.
Unfortunately, this data set doesn’t yield itself to a good, sensical calculation with AllNext, so I am going to skip it. Hopefully, you understand that it works the same as AllPrevious, just in the opposite direction. Next week will feature FirstNode, LastNode, LastPeriods, PreviousPeriod, and NextPeriod.
Wrap Up
Wow, that was a really long blog post, but I think it’s a good warm-up to understanding the All, Previous, Next, AllNext, and AllPrevious node navigation methods. It also serves as an introduction to Axis Names. Now, you might be asking the question — What if I want to write these calculations on different types of visualizations? Well, you definitely can. THis series will show you how after I get thru all the node navigation methods.
Spotfire Version
Content created with Spotfire 10.2.
Pingback: Node Navigation - FirstNode, LastNode, LastPeriods, PreviousPeriod & NextPeriod » The Analytics Corner
Pingback: Master NavigatePeriod Node Navigation » The Analytics Corner
Perfect explanation !
Pingback: Calculate the Last Value on a Visualization » The Analytics Corner
Pingback: How to Save Space in Spotfire Tooltips » The Analytics Corner