This is post 8 in my series on learning the Spotfire expression language. We are in the middle of exploring all of the node navigation methods. This post will cover FirstNode, LastNode, LastPeriods, PreviousPeriod and NextPeriod. I’m combining these particular methods in order to differentiate between Node, Period, and Periods. Read on to learn the difference.
In my very first post in this series, I explained that there are 2 ways to write expressions in Spotfire. You can write them into a data table or as a custom expression on the axis of a visualization. For a long time, I was under the impression that some node navigation methods could only be used with custom expressions. But, that is not true. It’s just a bit tricky. I’ll show you as we walk through examples.
The Data Set
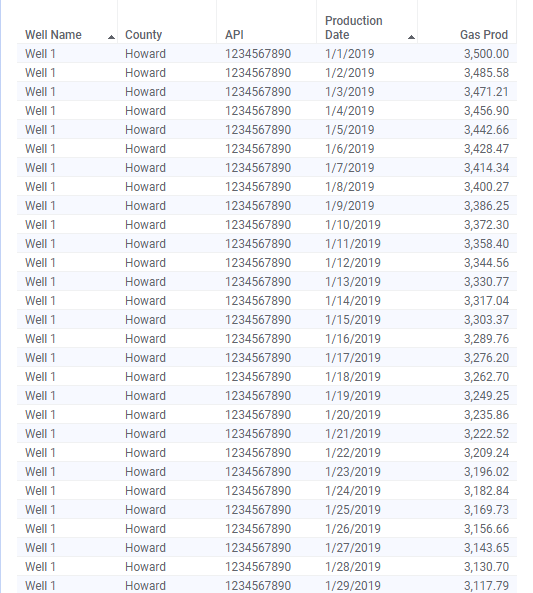
Examples are drawn from a fictitious data set containing daily production data for 5 gas wells from 1/1/2019 to 3/31/2019. I generally try to keep data sets small or short so it’s easy to follow along, but I will need to create a date hierarchy, so I have included 3 months of data. The API column is a unique identifier for each well. Here’s a snippet of what it looks like.
I’ll show each method in a calculated column and a custom expression so you can see the difference. For simplicity, all examples will use a bar chart. As a friendly reminder, calculated columns always use the entire data set. This is distinctly different from custom expressions written on the axis of a visualization, which incorporates filtering.
Let’s get started using the LastPeriods node navigation method. I used the TIBCO documentation to develop this explanation. You can find it here.
LastPeriods
LastPeriods is commonly used to calculate moving averages. It’s also a good starting place because Spotfire contains a native aggregation method you can use as a guide when learning.
Calculation objective: calculate the 5-day moving average of gas production for each well.
Calculated column
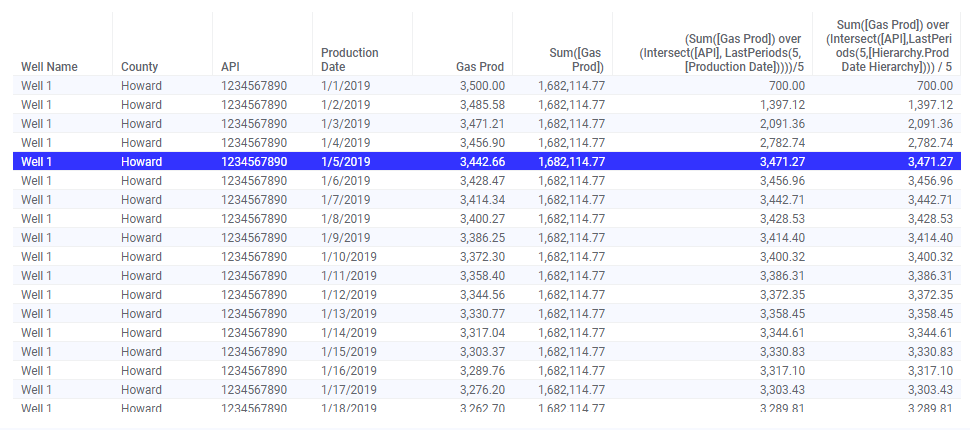
Calculated column:Sum([Gas Prod]) over (Intersect([API],LastPeriods(5,[Production Date]))) / 5I use the Production Date column to calculate the moving average. Because each unique value in the Production Date column equals one day, my period(s) in this case are days. If I was looking at monthly production data, the period(s) would be months. Here are a few things to note.
- I use the sum function (rather than average) and then divide by the number of days.
- The calculation is ALWAYS summing and diving by 5. Thus, the first four days don’t reflect an accurate moving average (ex. 3500 / 5 = 700). Compare the values for 1/1 – 1/4 in the table to the values in the chart shown below. This is one reason you might prefer a custom expression for moving averages to a calculated column.
- The result comes out the same with the Production Date column or hierarchy column, Prod Date Hierarchy. When using the hierarchy column, Spotfire treats it the same as the Production Date. You cannot navigate within the hierarchy from a calculated column. I have asked Spotfire support this question, and it is not designed to do so. One more reason to write a custom expression.
Custom Expression
When writing a similar custom expression, we can make use of the Moving Average aggregation. As you can see, the custom expression also begins with a Sum function. Then, it averages that Value over the last 5 periods as defined by Axis.X. The last line of the expression is telling the calculation to return null until the specified number of periods have occurred.
Custom expression:Sum([Gas Prod])
THEN Avg([Value]) OVER (LastPeriods(3,[Axis.X]))
THEN If(Count() OVER (LastPeriods(3,[Axis.X]))=3,[Value],null)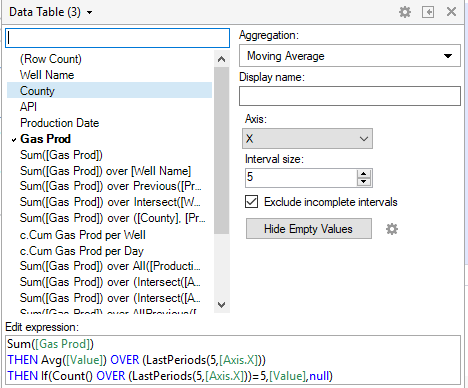
Note the following three points.
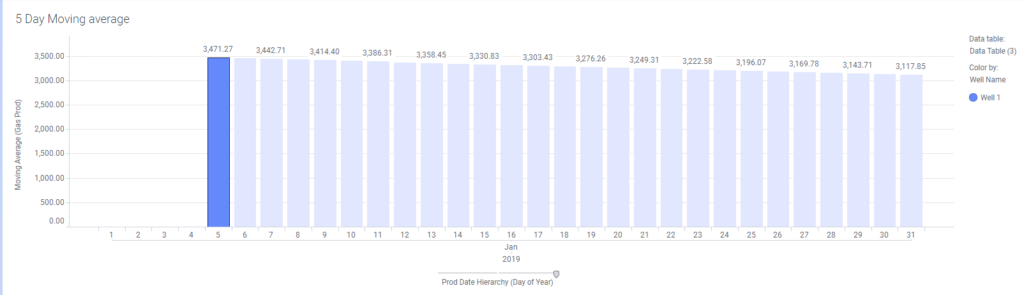
- When working with node navigation in custom expressions, you must place a hierarchy on the x-axis. If I were to replace Prod Date Hierarchy with the Production Date column, the expression would error.
- Prod Date Hierarchy is on the x-axis and is set to days. If I were to move the hierarchy slider to months, it would calculate a 5-month moving average.
- There is no value until day 5. The custom expression requires 5 periods in order to calculate.
The custom expression is more dynamic than the calculated column because you can change the hierarchy and utilize filtering. Next, let’s look at FirstNode and LastNode before moving on to PreviousPeriod and LastPeriod.
FirstNode
For the remaining node navigation explanations, I’ll show the custom expression first because the values are easier to see on the bar chart. The TIBCO documentation describes FirstNode as “selecting the first node on the current level”. For a bar chart, that means FirstNode will select the first bar on the chart for whatever level the hierarchy is set to. Let’s look at an example.
Custom Expression
Calculation objective: calculate the difference in gas production between the first month of the data set and all other months
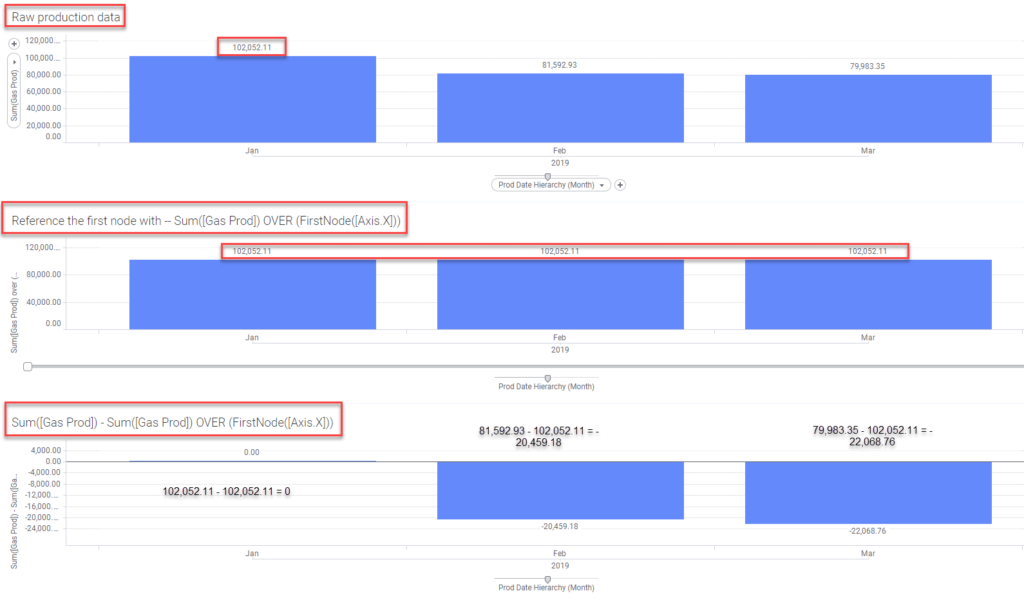
Custom expression:Sum([Gas Prod]) - Sum([Gas Prod]) over (FirstNode([Axis.X]))Below, I am showing three bar charts to progressively demonstrate FirstNode. The first bar chart contains the raw data for reference. The second bar chart sums gas production for the first node. As you can see, the same value is returned for all three months. The value returned is the value for January because my expression is essentially only asking for the value of the first node. Thus, the value repeats. Then, the final bar chart performs the desired calculation. It calculates the difference between the gas production for the current node (or current month) and the first node (or first month).
Calculated Column
To clearly demonstrate the calculated column, I’ve added an intersect keyword in order to create the calculation for each API number.
Calculation objective: calculate the difference in gas production, for each well, between the first month of the data set and all other months
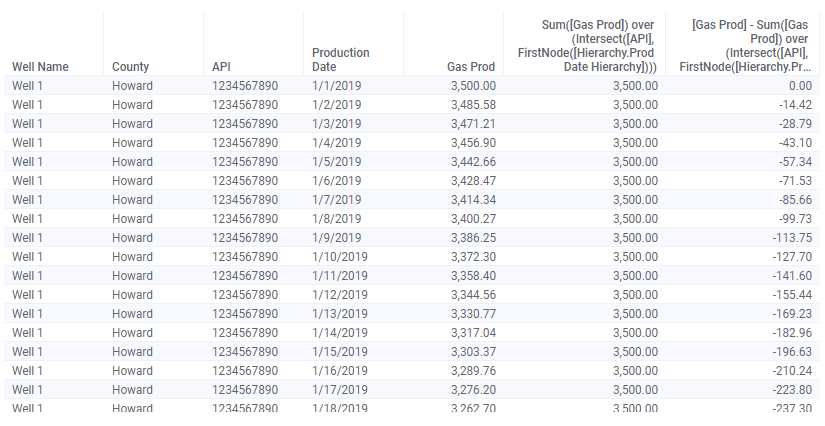
Calculated column:[Gas Prod] - Sum([Gas Prod]) over (Intersect([API],FirstNode([Hierarchy.Prod Date Hierarchy])))Again, you can see the raw data. Then, I simply sum gas prod using FirstNode. Finally, the desired calculation subtracts production for the current record from the FirstNode.
Now, let’s move on to LastNode.
LastNode
As you might have guessed, FirstNode and LastNode work the same way, just in opposite directions.
Custom Expression
Calculation objective: calculate the difference in gas production between the last month of the hierarchy and all other months
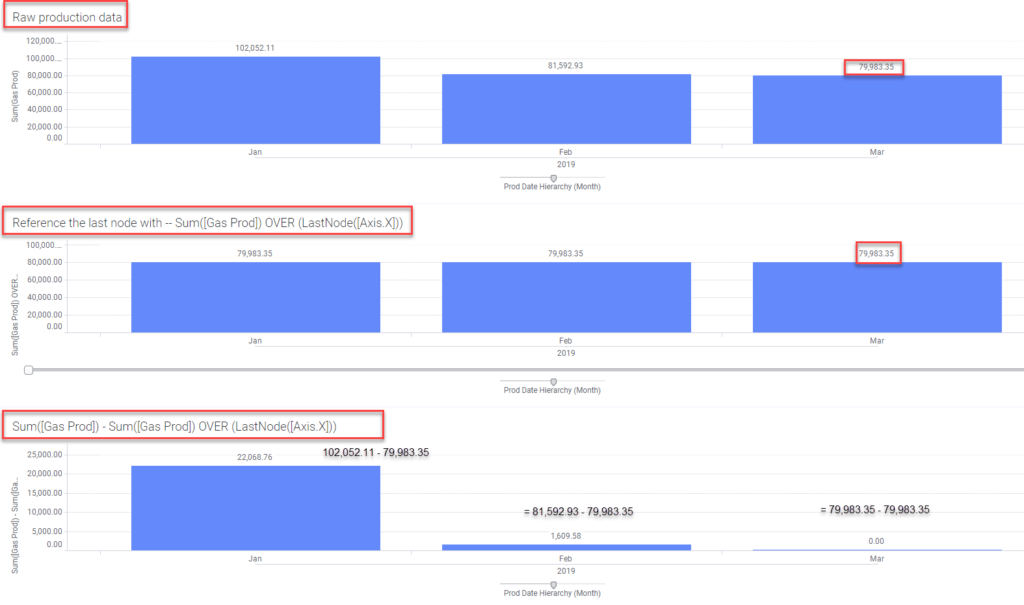
Custom expression: Sum([Gas Prod]) - Sum([Gas Prod]) over (LastNode([Axis.X]))Here, I show the same progression of data for LastNode as with FirstNode. LastNode behaves the same as FirstNode, except it pulls data from the last node on the hierarchy (March).
Calculated Column
Again, I added the intersect keyword in order to create the calculation for each API number.
Calculation objective: calculate the difference in gas production, for each well, between the last month of the data set and all other months
Calculated column:[Gas Prod] - Sum([Gas Prod]) over (Intersect([API],LastNode([Hierarchy.Prod Date Hierarchy])))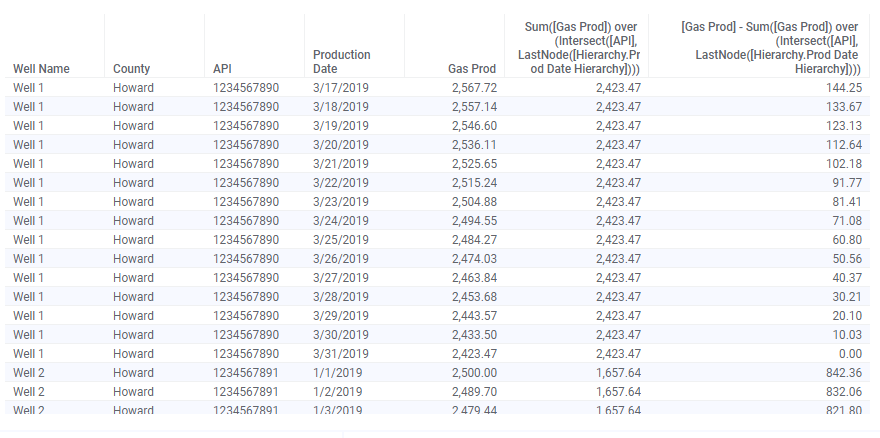
Next, let’s look at the difference between a node and a period by comparing FirstNode and LastNode to PreviousPeriod and NextPeriod.
PreviousPeriod
Both FirstNode and LastNode reference only the first or last bar (aka node) on the chart. PreviousPeriod and NextPeriod are different in that they reference all bars or periods on the chart.
Custom Expression
Calculation objective: calculate the difference in production between the current month and the previous month.
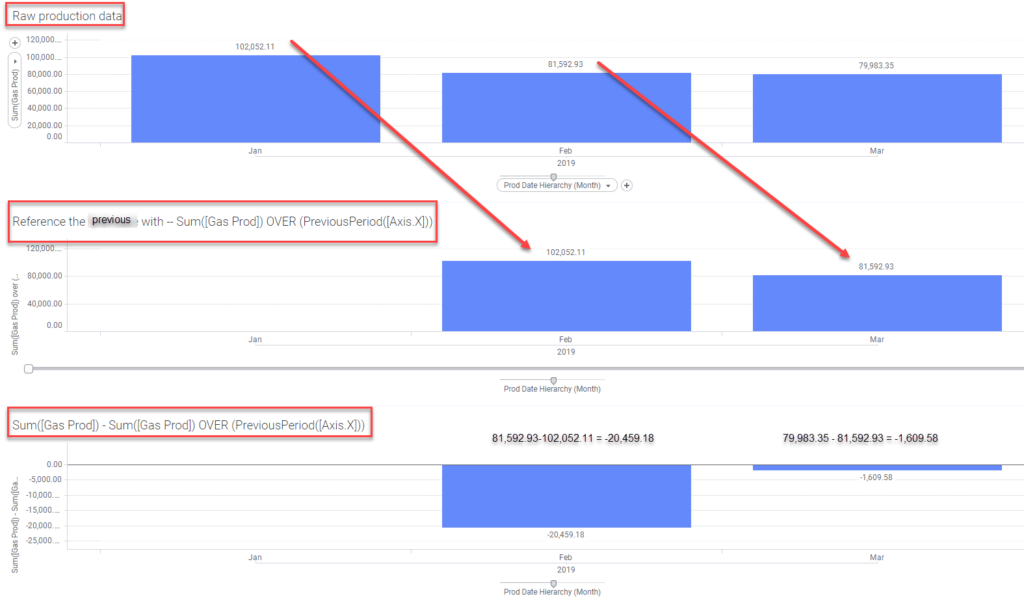
Custom expression:Sum([Gas Prod]) over (PreviousPeriod([Axis.X]))I’ve used the same 3 chart approach to demonstrate how PreviousPeriod works. The first chart is the raw data. The second chart sums gas production for the previous period. Finally, the third chart calculates the difference in gas production between the current node and the previous period.
Calculated Column
Calculation objective: calculate the difference in production from day to day for each well
Calculated column: Sum([Gas Prod]) over (intersect([API], PreviousPeriod([Hierarchy.Prod Date Hierarchy])))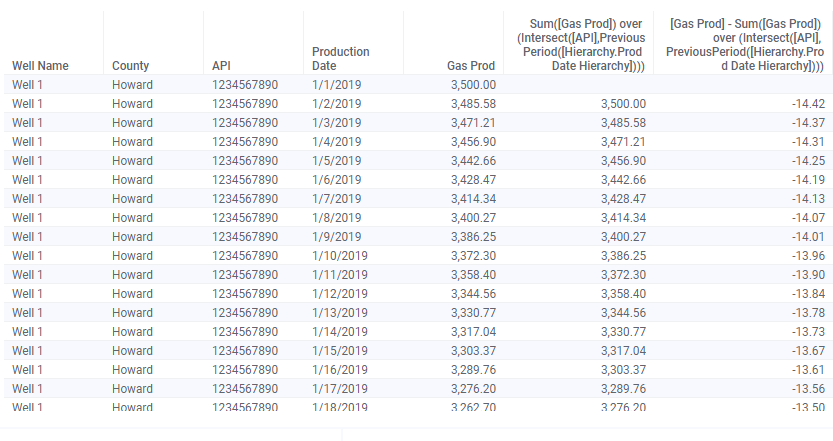
NextPeriod
NextPeriod works the same as PreviousPeriod, just in the opposite direction. I expect you’ll have this down by now, so I’ll cut down on the commentary and just show the examples.
Custom Expression
Calculation objective: calculate the difference in production between the current month and the next month.
Custom expression:Sum([Gas Prod]) over (NextPeriod([Axis.X]))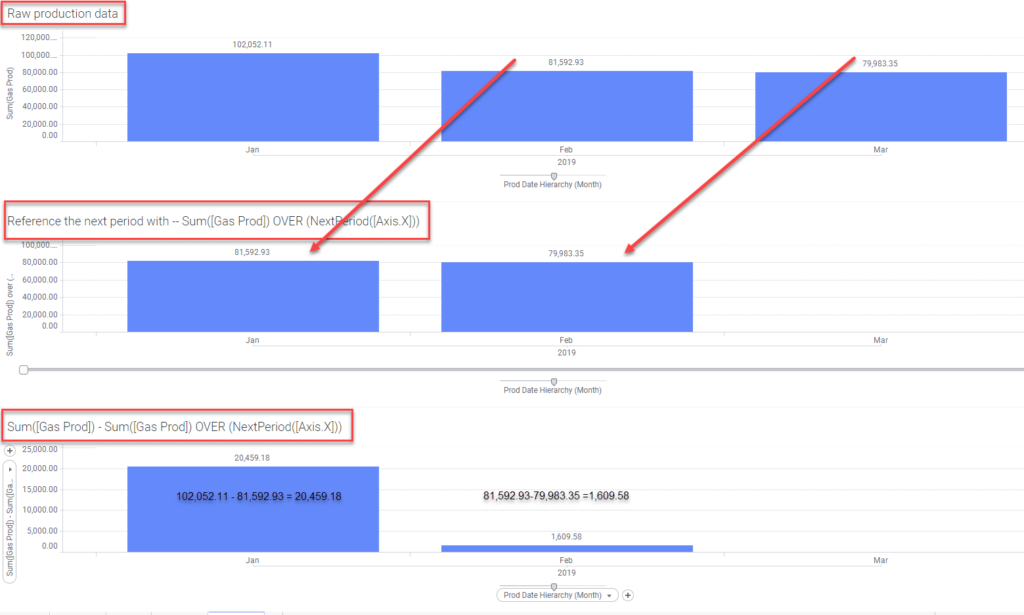
Calculated Column
Calculation objective: calculate the difference in production from day to day for each well
Calculated column:[Gas Prod] - Sum([Gas Prod]) over (intersect([API], NextPeriod(Hierarchy.Prod Date Hierarchy])))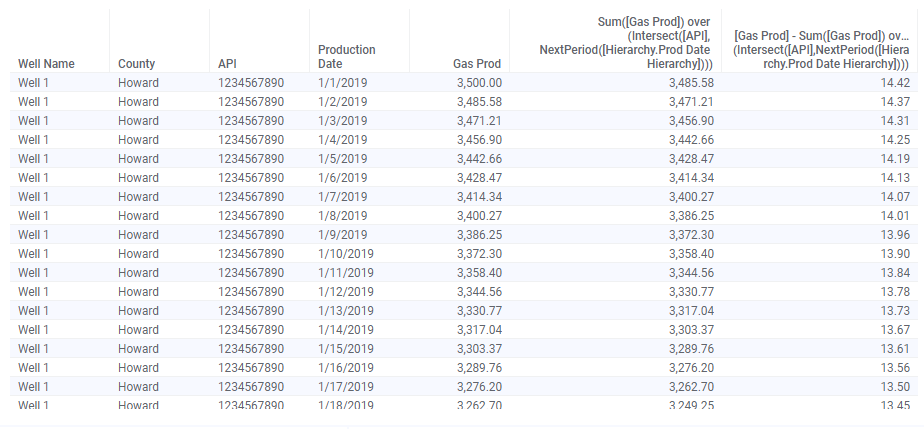
Wrap Up
That was quite a lot of content for one post. Maybe bookmark this one as a reference going forward. Now, you understand how to use LastPeriods, FirstNode, LastNode, PreviousPeriod, and NextPeriod. However, you might have noticed we didn’t traverse the hierarchy or the x-axis. That is coming up in the next post that will cover NavigatePeriod, ParallelPeriod, and Parent.
Spotfire Version
Content created with Spotfire 10.2.
Pingback: Master NavigatePeriod Node Navigation » The Analytics Corner
I’m trying to use the below formula (slightly modified from one in this page) to avg gas prod over “X” number of previous days, with “X” coming from a Property Control drop down via Document Properties.. and I can’t seem to get it to work. Any help would be greatly appreciated!
If([Taxonomy] IN (“Gas Sales Volume”, “Gas Check Volume”),Avg([Real Value]) OVER (Intersect([DCPid],LastPeriods(DocumentProperty(“AvgNumDays”),[ActivityDate]))),null)
*Document Property Settings are Fixed Values
The formula works fine when I type in a number after “Last Periods”
If([Taxonomy] IN (“Gas Sales Volume”, “Gas Check Volume”),Avg([Real Value]) OVER (Intersect([DCPid],LastPeriods(5,[ActivityDate]))),null)
I assume you have tried both versions of the syntax for the property control? To Troubleshoot it, I would create an entirely different visualization with a simpler expression that uses last periods. It seems like a syntax problem, so simplify it to work that out.