
This week I worked with one of our engineers on a Spotfire project where he needed to filter out nulls and zeros from his visualizations. This should be easy, but users set the y-axis columns using a property control. Basic data limiting by expression was impossible because the columns kept changing. Limiting data when columns change is challenging but not impossible. There are two ways to do it. Read on to learn more.
Blog or Video
My Use Case
Let’s start with a brief explanation of the use case. It’s real simple. The engineer was comparing actual to budget and some wells had null or zero values, and he wanted to get rid of these. Limiting was complicated because a list box multi-select property control set the y-axis. He couldn’t just write an expression like [Actual Capital] != 0. That wouldn’t work because the columns could change.
For the purpose of this post, I created a dummy data set with a mix of zero and null values to show you exactly how it works. For the sake of simplicity, if a well has nulls or zeros, it will have them in all columns. Thus, you don’t have to worry about which column is selected in the property control.

And here is that data placed in a simple cross table. If a Well has nulls or zero, it still appears.

And this is what users interact with. They make column selections from a list box multi-select property control. It populates a bar chart.

Below the bar chart is a cross table details visualization. In order to demonstrate the solution, I have placed two cross tables below the bar chart, one with the solution and one with out.

As you can see, the cross table titled “Data Limiting” has a solution applied, and does not contain Well 3. Well 3 had nulls for both actual and budget. So, how to we create this solution? How do we make limiting data when columns change possible?
Solution 1 – Data Limiting
The answer lies with the $esc function, which reads a string from the property control and puts square brackets around it. In Spotfire, square brackets are only used for column names. This is how we get a column name into an expression that says — show values not equal to zero. If you aren’t familiar with the $esc or $map functions, check out this post.
Sum($esc(${ListBoxMulti}))!=0It is worth noting that the precise translation of this expression is
Sum([Budget Revenue], [Actual Revenue])
Because the expression adds Budget Revenue and Actual Revenue columns, a well is removed only when actual and budget are both zero.

If you want to get rid of wells where either budget or actual is zero or null, the $map function must be used. The $map function creates a template that allows you to repeat an expression with some variation. The $map function is explained in this post.
$map("$esc(${ListBoxMulti})!=0", " and ")This syntax results in the following expression.
[Actual Revenue]!=0 and [Budget Revenue]!=0

Now, wells 3, 6, 8, and 9 come out. Next, let me show you how you can also use the Show Hide function to perform a similar task.
Solution 2 – Show/Hide
The second solution uses the Show/Hide function in the Properties dialog.
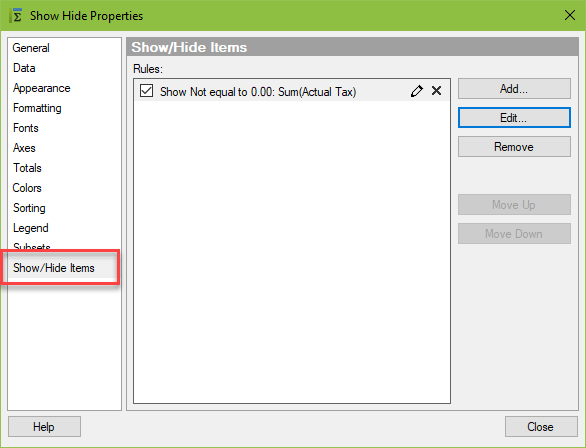
Within Show/Hide, we configure a custom expression (shown below). The rule associated with the expression says to Show items when the value from the custom expression is not equal to 0.

The custom expression uses the exact same expression as what we have on the bar chart.

The resulting cross table excludes wells 3, 6, and 8 for the Actual Tax column (nulls and zeros removed).

Now, you might have noticed that in this example, I only selected one column of data. When using more than one column with this solution, the following error appears. If you go to the expression dialog, it says, “Multiple expressions are not allowed.”

Just to tinker with it, I copied and pasted both of the expressions successfully used in data limiting. In both instances, it changed the rule type to “Boolean expression”, and threw an error. Entering in — Sum($esc(${ListBoxMulti}))!=0 — didn’t help me much. But upon entering in the second expression — $map(“$esc(${ListBoxMulti})!=0″, ” and “) — I got a clue in the error.
It said, “An aggregation method must be specified.” And, I can see from Spotfire’s interpretation that I don’t have any aggregation around the columns.

A simple modification to the expression will fix this problem.
OLD: $map("$esc(${ListBoxMulti})!=0", " and ")MODIFIED: $map("Sum($esc(${ListBoxMulti}))!=0", " and ")
Spotfire changed the rule type to Boolean expression because Show/Hide works slightly differently from data limiting with expression. I’ll have a blog post coming out about this shortly.
The expression is evaluated against the value on the y-axis as either true or false. If the value on the y-axis results in true, Spotfire shows the data. If false, Spotfire hides the data.

Once in the Value dialog, you can see Axis.Value is the only option.

And with that, the Show/Hide option removes wells 3, 6, 8, and 9 and works exactly the same as the second data limiting option.

Summary
Because I jumped around quite a lot there, here is a summary of the expressions, the translations, and the result. Now you know all about limiting data when columns change.

Spotfire Version
Content created with Spotfire 10.3.
Pingback: Data Limiting with Expression versus Show Hide » The Analytics Corner