This is my third week working thru IronPython scripts from the Spotfire IronPython quick reference. Last week, we looked at for loops. The week before, we used IP to modify titles. This week, we’ll insert visualizations with IronPython and explore the API as we go. We’ll get started learning how to add a bar chart with IronPython to an analysis.
Add Bar Chart With IronPython – The Code
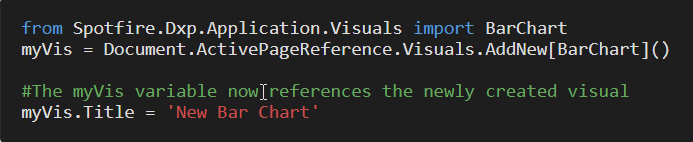
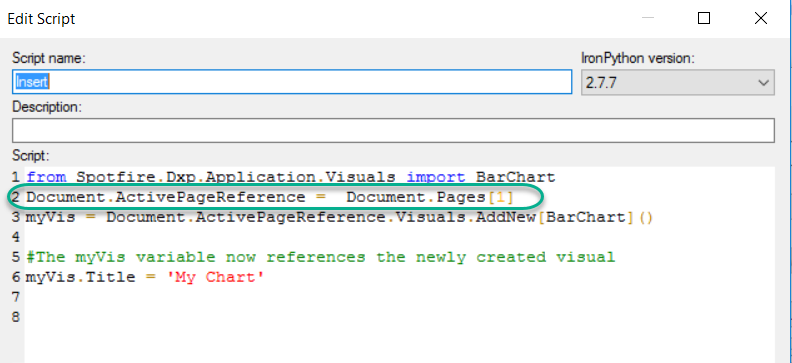
To begin, here is the code snippet for this week. It inserts a bar chart into a page.
Technically, the code works. However, this was the result.
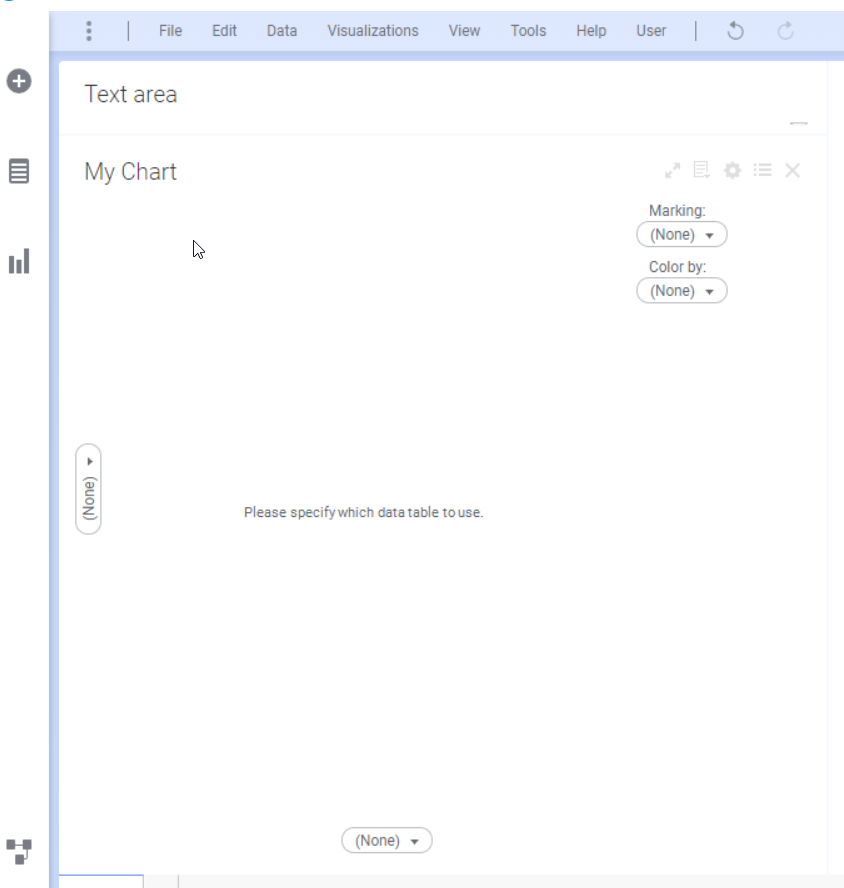
I believe I used this code in a previous version of Spotfire, and the result was a bar chart connected to the default data table. In version 10.2, we must set the data table.
I poked around at the Spotfire.Dxp.Data namespace looking for something to get or set the data table. Unfortunately, my initial attempts didn’t yield an output. Normally, I would have cranked away on it for a while, but the week is rapidly drawing to a close, so I reached out to TIBCO support. I want to give a big thanks to Shandilya Peddi for helping me out. Two potential solutions were provided.
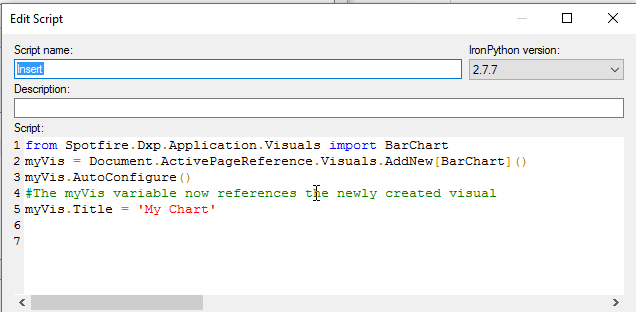
Solution 1
The first solution uses Spotfire’s auto-configure functionality. It produced the same result as adding a bar chart through the UI and sets the table to the default table. Note, we don’t import any additional namespaces or classes.

Solution 2
The second option specifies the table to connect to. As you can see, I was sniffing around the correct namespace — Spotfire.Dxp.Data. We import Spotfire.Dxp.Data namespace and then create an object called “table” specifying the table. After creating the bar chart, we use that object to set the data table.
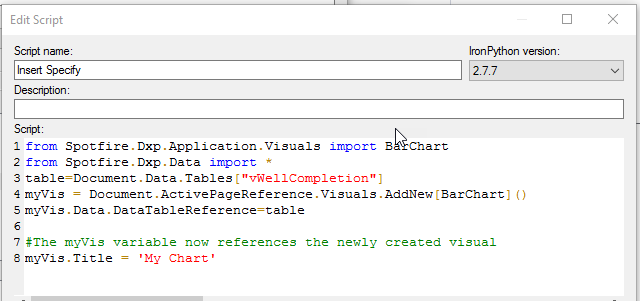
When using this solution, columns are NOT added to the x and y-axis. The chart comes out blank like this.
More code is required to fully configure the chart, but I’m not going to cover that today.
Code Summary
Here is the modified code again so you don’t have to scroll up. Let’s talk through what happens in each line.
Firs,t line 1 imports the required class from the namespace.
from Spotfire.Dxp.Application.Visuals import BarChartLine 2 creates an object called myVis that is a new bar chart. myVis is defined as follows:
Document.ActivePageReference.Visuals.AddNew[BarChart]()In summary, here’s how it interacts with the API:
- Document class is part of the Spotfire.Dxp.Application namespace.
- ActivePageReference is a property of the Document class.
- Visuals is a property from the Page class in the Spotfire.Dxp.Application namespace.
- AddNew is a method from the VisualCollection class in the Spotfire.Dxp.Application namespace.
- BarChart is a class from the Spotfire.Dxp.Application.Visuals namespace.
So, the code is working down from the document to the page to the visual to the specific visualization.
Next, line 3 applies the AutoConfigure method from the BarChart class to the myVis object.
myVis.AutoConfigure()Finally, line 5 uses the Title property to sets the title to ‘My Chart’.
myVis.Title = 'MyChart'Spotfire API
The full API reference is located here. Here is a comprehensive list of all the namespaces, classes, properties and methods used.
- Namespaces
- Spotfire.Dxp.Application
- Spotfire.Dxp.Application.Visuals
- Classes
- BarChart class from Spotfire.Dxp.Application.Visuals
- Document class from Spotfire.Dxp.Application
- Page class from Spotfire.Dxp.Application
- Visual class from Spotfire.Dxp.Application
- VisualCollection class from Spotfire.Dxp.Application
- Properties
- ActivePageReference is a property of the Document class
- Visuals property from the Page class
- Title property from the Visual class
- Methods
- AutoConfigure method from the BarChart class
- AddNew method from the VisualCollection class
- Developer created objects
- myVis
Lastly, I just want to point out that we imported the Spotfire.Dxp.Application.Visuals namespace. But, we did not import the Spotfire.Dxp.Application namespace. Most of the classes in Spotfire.Dxp.Application namespace are imported by default except few like DocumentSaveSettings and DocumentOpenSettings.
Before I wrap up this post, I came up with a few modifications to share.
Code Modifications
Specifying the Page
I was curious if I could specify the page where the chart is inserted. The answer is yes. You can use an index to specify the Document.ActivePageReference (i.e. where the chart is inserted).
Inserting Other Visualizations
This code can also be modified to insert other visualization types. Just use the references shown below.
- BarChart
- BoxPlot
- CombinationChart
- CrossTablePlot
- HeatMap
- HtmlTextArea (for Text Areas)
- KpiChart (available Spotfire 7.8 and up)
- LineChart
- ParallelCoordinatePlot
- PieChart
- ScatterPlot
- ScatterPlot3D
- SummaryTable
- TablePlot (for Tables)
- Treemap
- WaterfallChar
Note, map charts and graphical tables work slightly differently. I’m not going to go into that difference here, but use the link.
Conclusion
Well, that wraps up this post. Now you know how to add a bar chart with IronPython. This week’s code snippet was only a few lines long, but it touched on a lot of the API. I feel like I’m starting to develop a better understanding of it the more and more I explore. Feel free to leave comments or suggestions!
Spotfire Version
Content created with Spotfire 10.2.
Pingback: Different IronPython to Add a Bar Chart to Spotfire » The Analytics Corner
Pingback: Setup to Use Python Data Functions in Spotfire » The Analytics Corner
Pingback: Set Multiple Scale Ranges with Document Properties » The Analytics Corner
After you get the basic chart created, the Axis needs to be assigned. I want to loop through a list of charts to create and change the axis on each one. I can’t find that Syntax.
I don’t have snytax for that. It might be possible. I know that when I was working on IronPython for lines and curves, I had code that would work for specific charts specified as parameters or by name. I also had other code that would just apply to all charts on the page. All I can tell you is that it wasn’t written as a loop. I am unfortunately not working with Spotfire much anymore. Sorry I’m not more help.
Hi Jullie,
Can we combine (Horizontal bar chart) with line chart or other chart together?
I got a request from customer that they want to see the trend of events also want to see how often of one trend inside bar chart so I am not sure if we can do that in Spotfire
Spotfire has a combination chart. You set how many bars/lines are used on the visualization.