Okay, after a long hiatus, I’m restarting the series on learning axis names in all of the Spotfire visualizations. I’ll pick up where I left off with axis names on cross tables.
Blog or Video
Axis Names in Cross Tables
Cross tables employ 2 axis names – Axis.Columns and Axis.Rows. Use Axis.Columns when slicing and dicing data with the horizontal axis. Use Axis.Rows when slicing and dicing data on the vertical axis. Not sure what that means? I’ll show you.
For my examples today, we’ll use this data set. You can see, my project contains a text area with 2 property controls and a filter. The property controls determine what shows up on the visualization, not the filter. I’ll explain why in just a bit. First, let’s focus on how to use Axis Names in cross tables, and then I’ll explain my full solution.

Axis.Columns
In the cross table below, date sits on the vertical axis and scenario comparison on the horizontal axis. The goal is to calculate the difference in amount between Scenario 1 and Scenario 2. Because scenario comparison is used on the horizontal axis, we will use Axis.Columns to calculate. If scenario comparison were on the vertical axis, we would use Axis.Rows.
The expression below calculates the difference. Spotfire takes the sum of amount from the current “node”. Then, it subtracts that amount from the sum of amount from the previous node, as defined by Axis.Columns. In this case, the previous node refers to the previous scenario. If you are unfamiliar with the term “node”, check out this post.
Sum([amount_grs]) - Sum([amount_grs]) over (Previous([Axis.Columns])) as [ diff]
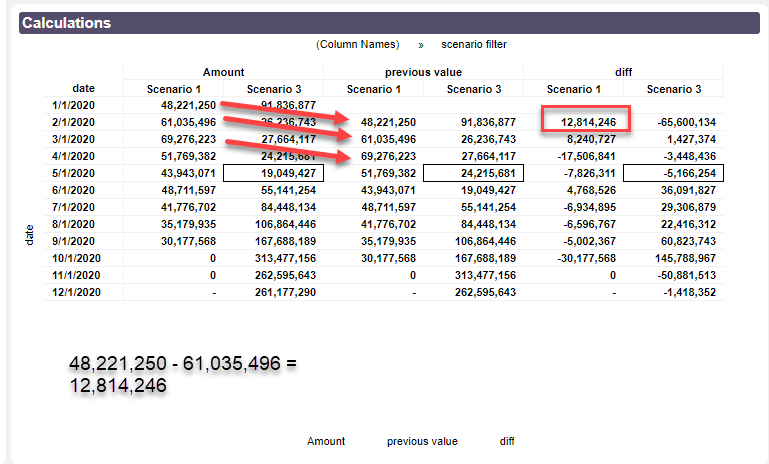
And to help you understand this, expression, I have created a cross table with amount, the result of Sum([amount_grs]) over (Previous([Axis.Columns])), and the difference calculation so you can see exactly what Spotfire is doing.


Additionally, the “previous” value for Scenario 1 is null because there is no previous. But beware, this simple comparison is a little bit of a trap!
It’s Definitely a Trap
First, know that calculated columns always calculate with all data or all records, regardless of filtering. Expressions written on the axis of a visualization are different. They calculate only using filtered data or filtered records, which is why we use them. However, node navigation (Previous, AllPrevious, Next, etc), works with all of the unique values in a column, not just the unique values of filtered data. This doesn’t make sense to me, but I don’t write software.
Now, the expression I gave you above works, if and only if, you only calculate the difference between two scenarios that are “next to” each other. In other words, it works if you compare Scenario 1 and Scenario 2 or Scenario 5 and Scenario 6. It will not work if you compare Scenario 2 and Scenario 7. See….

So what does “next to” really mean? What does “previous” really mean? Spotfire interprets the order of data in a column according to the Sort properties in Column Properties as shown here.

Technically, previous or next, is whatever you want it to be since you can change the sort order. However, that won’t fix this problem. What will?
Three Step Solution
This is where the property controls come into play. To fix this problem, I did the following….
- Created 2 drop-down property controls that allow me to select 2 scenarios or forecasts to compare from the forecast filter column.
- Created a calculated column called scenario comparison using the logic shown below. This column only populates for the two scenarios or forecasts I am interested in. This column is placed on the horizontal axis of the visualization instead of the forecast filter column.

- Applied data limiting to the visualization to only populate where scenario comparison is not null.

And that is how I created the screenshot at the very start of the post (also shown below). With the property controls (not the filter), I populate the scenario comparison column, which is placed on the top of my visualization. It only populates for the 2 scenarios I care about, and the calculations are correct because no matter which scenarios I choose, one is always previous to the other.

That was a lot, but now you know how to use Axis.Column and also how to handle the biggest pitfall of using Axis.Columns. So, let’s move on to Axis.Rows.
Axis.Rows
For Axis.Rows, we’ll work with the exact same example, but we’ll calculate a different value. Instead of calculating the difference between scenarios, we will calculate the difference between months. Because Date sits on the vertical axis, we will use Axis.Rows to calculate.

The expression below calculates the difference. Spotfire takes the sum of amount from the current “node”. Then, it subtracts that amount from the sum of amount from the previous node, as defined by Axis.Rows. In this case, the previous node refers to the previous date or previous month.
Sum([amount_grs]) - Sum([amount_grs]) over (Previous([Axis.Rows])) as [ diff]
Because the dates occur in chronological order, we won’t have the same problem using Axis.Rows that we did with Axis.Columns, so this is a much simpler task.
Next week, I’m going to show you how the same expression won’t work when you are working with Counts. But, I have a solution!
Spotfire Version
Content created with Spotfire 10.3.
Pingback: Use IronPython to Navigate Spotfire Pages » The Analytics Corner
Pingback: The Danger of Hiding Data in Spotfire » The Analytics Corner