
A coworker reached out to me for help on a visualization. He was using a drop-down property control to set the value of a bar chart x-axis. If he chooses option 1 or option 2, the display name should be a certain value. If he chooses option 3 or option 4, a different value should appear. I’ve definitely had this come up before when using dropdown property controls. There is an IronPython solution for creating dynamic display names. Let me show you.
The Use Case
Let me explain exactly what my coworker was trying to do. First, he created a drop-down document property called “Oneline”. Oneline contains a list of column names. It is also part of an expression on the x-axis of a bar chart as shown below.
If("${Oneline}"="LEASE" OR "${Oneline}"="API",Max([AAT_DATA].[PROPNUM]),String(UniqueCount([PROPNUM]))) as [PROP COUNT] As you can see, he was using the “As” keyword to set the display name as “PROP COUNT”. Really, he wanted a more dynamic display name. If the user chose “LEASE” or “API” from the drop-down, the display name should be “PROPNUM”. Otherwise, it should say “PROP COUNT”.
Now, you can’t achieve a dynamic display name by modifying the expression. You have to use IronPython. Before I dive into the solution, I just want to touch on the “As” keyword in case folks aren’t familiar with it.
The As Keyword
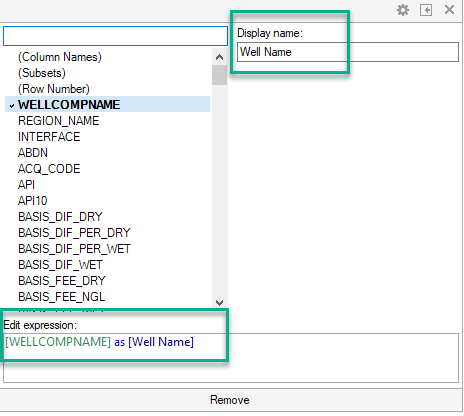
The “As” keyword allows us to rename columns of data on the axis of a visualization. If you modify the display name using the text box, under the covers, Spotfire writes an expression using the “As” keyword as shown below.
Now, let’s look at the solution components.
Solution Components
This is a four-part solution.
- A dropdown document property.
- A label property control.
- An IronPython script.
- A custom expression on the axis of the visualization.
Here’s how it works.
- The dropdown property control holds the list of columns that could be selected for the x-axis.
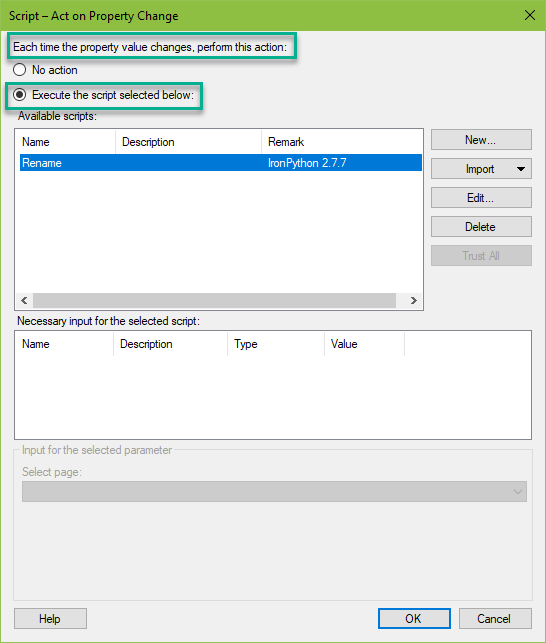
- The IronPython script is attached to the drop-down property control and runs anytime the drop-down changes. The script looks at the value in the drop-down and applies an IF statement.
- The script places the result of the IF statement in the label property control (using IronPython).
- Then, the label property control is used in the custom expression on the axis of the visualization. Just for clarity, both the dropdown property control and the label property control are referenced in the custom expression.
And here is a video that shows the x-axis description change as the drop-down is changed.
Solution Details
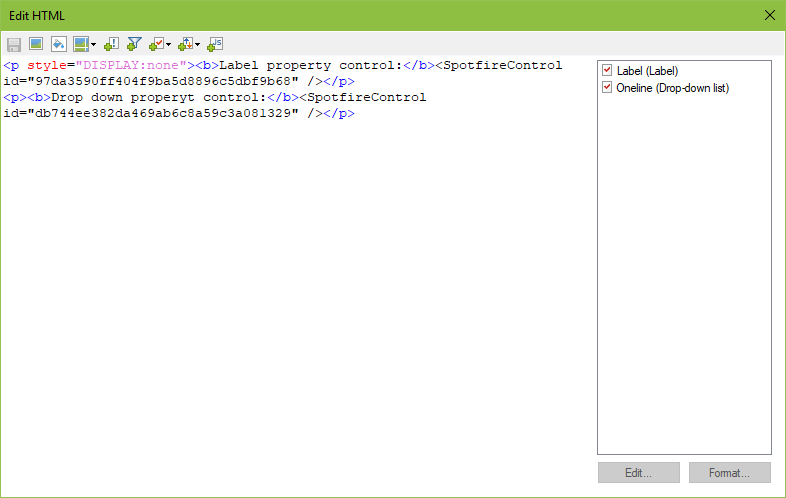
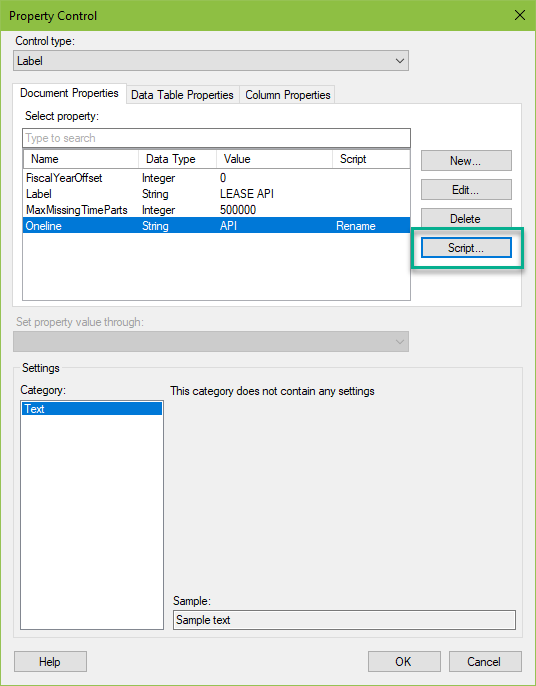
Now, I’m going to show you the whole solution. Let’s start with the property controls. have created a label property control called “Label” and a drop-down property control called “Oneline”. I have added the style attribute to hide the label. Users don’t need to see it.
Next, let’s take a look at the IronPython script attached to the Oneline drop-down.
Code Snippet
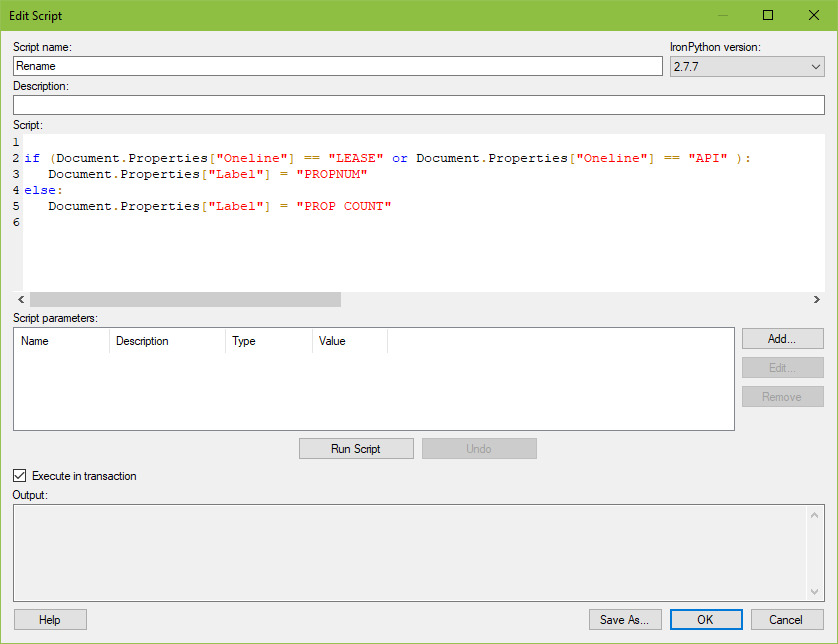
The code looks at the drop-down property control. If the property control is equal to “LEASE” or “API”, then it sets the label property control to “PROPNUM”. Else, set the label to “PROP COUNT”.
To copy and paste the code snippet, use this.
if (Document.Properties["Oneline"] == "LEASE" or Document.Properties["Oneline"] == "API" ):
   Document.Properties["Label"] = "PROPNUM"
else:
   Document.Properties["Label"] = "PROP COUNT"
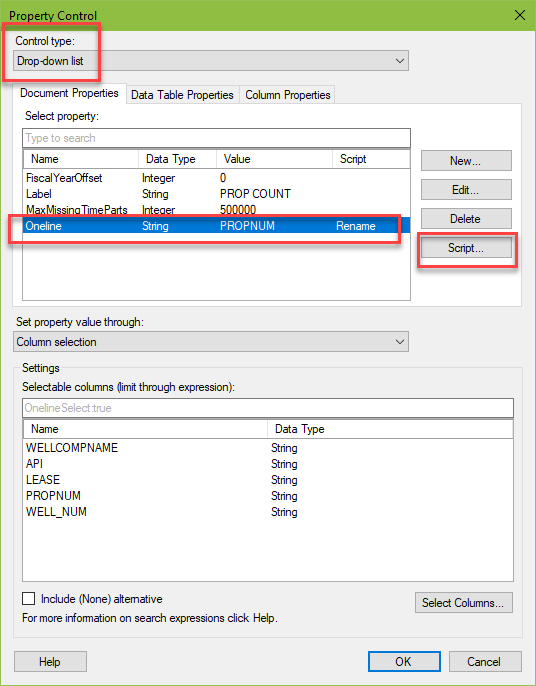
In order for this to work, attach the code to the dropdown. It’s easy to attach a script to a property control by clicking the script button as shown here. When the dropdown changes, the script triggers an update of the label.
Here is what the full custom expression looks like on the bar chart. The display name updates with the label.
If("${Oneline}"="LEASE" OR "${Oneline}"="API",Max([AAT_DATA].[PROPNUM]),String(UniqueCount([PROPNUM]))) as [${Label}]Creating dynamic display names is easy once you know how to incorporate IronPython with the property controls.
Spotfire Version
Content created with Spotfire 10.2.
If You Enjoyed This, Check Out…
My other IronPython posts, such as…
Pingback: Use the Over Keyword » The Analytics Corner
I have found myself coming back to this site repeated this month as I continue to build out reports for my company. I have a similar usecase to dynamically change the dusplay name of a column being displayed on a line chart and a details table to the selection made in a dropdown input control. I use this method and it works only for the first time a selection is made. If the user changes the selection, the scrip runs and changes the label text, but the display name no longer reads …as [${Label}] and instead is hard coded to the first user selection. Any ideas on how to fix that?
Hi Mike, I’m glad the site has been helpful. My Spotfire work continues to live on, but I haven’t worked with Spotfire in about 3 years. Sorry I don’t have a solution for you.