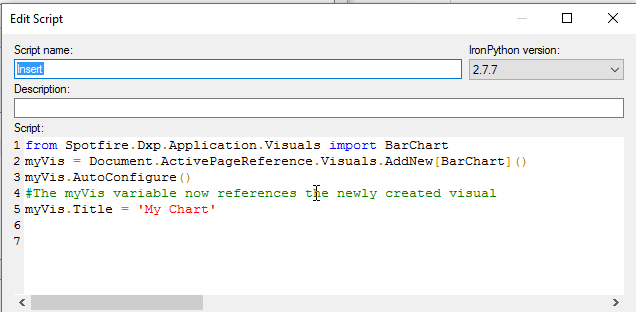
Last week, my post explained a script from the Spotfire IronPython Quick Reference website that will add a bar chart to a page with IronPython. The original code I discussed is shown below. Unfortunately, when applied, this piece of code returned a blank visualization. I made modifications to get a different result, but my explanation of the code walked through the simple version. This week, I want to get into the details of the modified code because it works differently. Ultimately, you’ll learn how to call tables with IronPython.
Differences in the Code
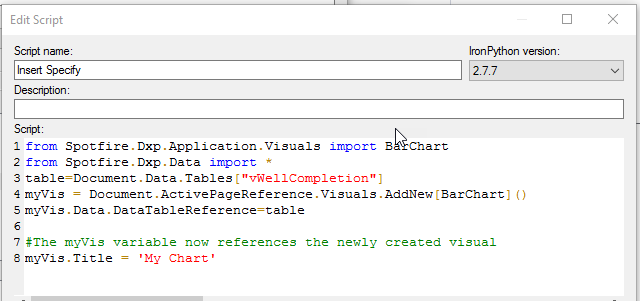
Because the two code snippets work different, I wanted to completely understand them. The snippet above uses a parameter to connect the code to the visualization. The modified code calls the tables with IronPython. It’s a subtle but important difference that means a much different interaction with the API.
To start, let’s walk through what each line of code is doing.
Code Summary
First, line 1 and line 2 import the required classes from 2 different namespaces.
from Spotfire.Dxp.Application.Visuals import BarChart
from Spotfire.Dxp.Data import *
Then, line 3 creates an object called “table” defined as follows.
Document.Data.Tables["vWellCompletion"]Here’s how it moves through the API:
- The Document class is part of the Spotfire.Dxp.Application namespace.
- Data is a property of the Document class.
- Tables is a property of the DataManager class in the Spotfire.Dxp.Data namespace.
Next, line 4 creates an object called myVis that is a new bar chart.
Document.ActivePageReference.Visuals.AddNew[BarChart]()Here’s how it interacts with the API:
- Document class is part of the Spotfire.Dxp.Application namespace.
- ActivePageReference is a property of the Document class.
- Visuals is a property from the Page class in the Spotfire.Dxp.Application namespace.
- AddNew is a method from the VisualCollection class in the Spotfire.Dxp.Application namespace.
- BarChart is a class from the Spotfire.Dxp.Application.Visuals namespace.
So, the code works down from the document, to the page, to the visual, to the specific visualization.
Next, line 5 makes use of the “table” object to set the data table of myVis object (our new bar chart).
myVis.Data.DataTableReference = tableAPI Explained:
- myVis is the bar chart.
- Data is a property of the Document class.
- DataTableReference is a property of the VisualizationData class in the Spotfire.Dxp.Application.Visuals namespace.
Finally, line 8 uses the Title property to sets the title to ‘My Chart’.
Spotfire API
Below, I have summarized all the parts of the API this code snippet uses.
- Namespaces Used
- Spotfire.Dxp.Application (loaded automatically)
- Spotfire.Dxp.Application.Visuals
- Spotfire.Dxp.Data
- Classes Used
- BarChart class from Spotfire.Dxp.Application.Visuals
- Document class from Spotfire.Dxp.Application
- Page class from Spotfire.Dxp.Application
- Visual class from Spotfire.Dxp.Application
- VisualCollection class from Spotfire.Dxp.Application
- VisualizationData class from Spotfire.Dxp.Application.Visuals
- DataManager class from Spotfire.Dxp.Data namespace
- Properties Used
- ActivePageReference is a property of the Document class
- Visuals property from the Page class
- Title property from the Visual class
- Tables property from the DataManager class
- Methods
- AddNew method from the VisualCollection class
- Developer created objects
- myVis
- table
In conclusion, the code snippet I discussed today achieved the same outcome as the previous piece of code. However, this code snippet used so much more of the API. I’m glad I took the time to walk through this one!
Spotfire Version
Content created with Spotfire 10.2.
Pingback: Copy and Paste, Then Filter with IronPython » The Analytics Corner
Pingback: Creating Dynamic Display Names for Spotfire Visualizations » The Analytics Corner