I love data limiting with expressions! It is my go-to method for data limiting because it is the most flexible. However, I found myself updating expressions over and over in tons of charts. It was just inefficient and painful. Then, I learned how to connect document properties to my expressions. Now, I know how to be more efficient in my data limiting. I promise this is worth your time! Read on to learn more.
Blog or Video
Data Limiting with Expressions
Data limiting with expression is my go-to method for data limiting because it offers the most flexibility. I can limit data differently in every single visualization if I want to. If you aren’t familiar with it, give this post a quick read. However, the big downside of this method is that you have to configure the data limiting one visualization at a time….or do you????
Document Properties Control Data Limiting by Expression
Actually, you don’t have to limit one visualization at a time. You can use Document Properties to control data limiting in many visualizations. Let me show you how.

Detailed Steps
- Write your data limiting expression. Here’s an example — (Year([stimint end datetime])=DocumentProperty(“year”)). This will limit the data on a visualization to the current year.
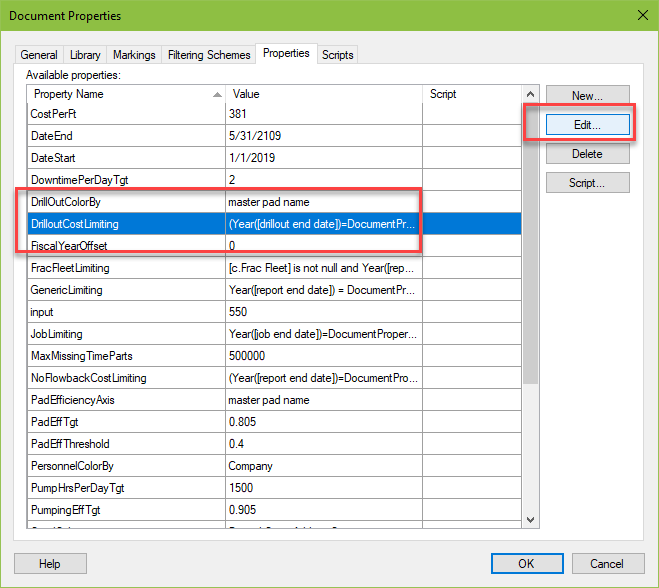
- Go to File > Document Properties > Properties tab >Click the New button to create a new document property.
- Name it. Set it up as a String data type.
- Paste in the data limiting expression.
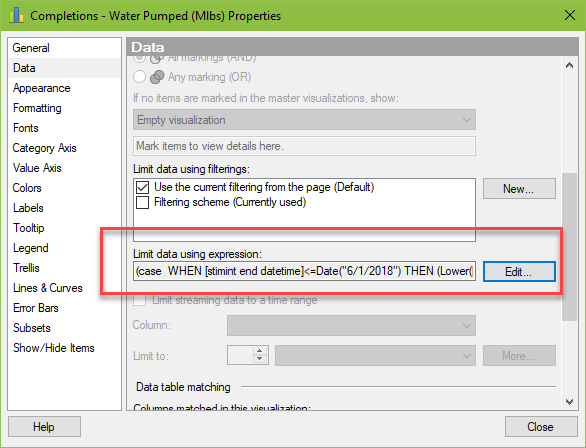
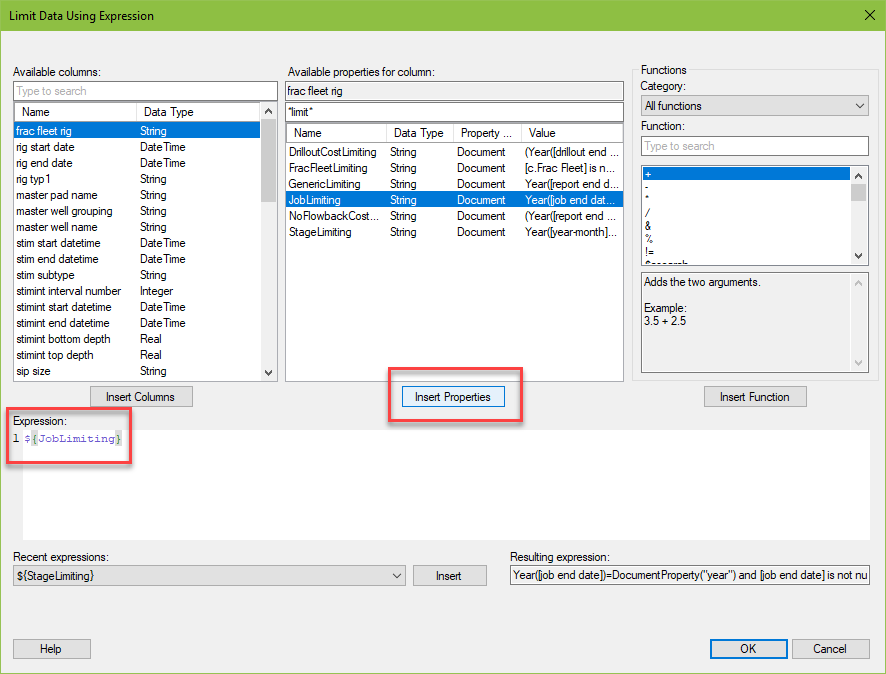
- Go to the visualizations() where data limiting should be applied. Go to Properties dialog > Data tab > Limiting by expression > Edit
- Find the document property under Available properties for column. Click the Insert Property button. DONE!!!
Making Updates
The best part of using document properties this way is easy updating. If you need to make a change, go to Document Properties, find the property and click Edit. Data limiting will update in all of your visualizations. No more repetitive updating!
Additionally, if your column names are the same across tables, you can even reuse them between tables.
In summary, because of this hack….
- You don’t have to look in every visualization to know what the data limiting is.
- You know you have been consistent in data limiting.
- Updates are quick and easy.
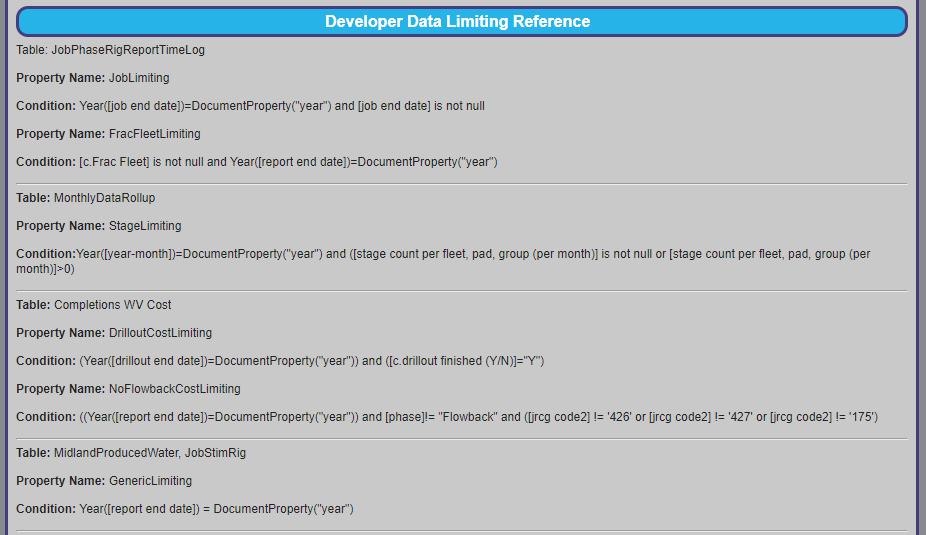
Now, before I wrap up, I just want to show you one more thing. Because I am using this hack so extensively, I created a key. This shows what data limiting is being applied to each of my tables. This is pretty difficult to keep straight in your mind, so a text area key helps.
Wrap Up
Using document properties to control data limiting by expression has really been a game changer for me. I hope you find it useful too!
Spotfire Version
Content created with Spotfire 10.3.
Julie, I am new to Spotfire and find your blog to be of great help. After reading this post and watching the video I was wondering if you could help me solve a specific Spotfire problem.
I have many time-series (category axis) stacked bar visualizations in my project. My time-series is 2011 through 2020 (ten discrete years). Can I dynamically limit that those years to show only say 2013, 2014, 2016 and 2019, or any other discrete combination? It is important I find a dynamic solution, as using visualization filters will be far to time consuming.
Any help would be greatly appreciated.
You can do that. Setup a property control (input multiple select or list box multiple select). If you do an input multiple select, it’s just an input. If you do a list box multiple select, set the years using fixed values. Then, use data limiting with expression to limit according to what is setup in the property control.
Hi Julie,
I have to create drop down property filters by including ‘NONE’ and when NONE is selected in the drop down i should be able to see all the data in the table and when i select a value the table should see only that filter. i know how to use datalimiting and achieve the filter application but if none is selected my table is going empty. Could you please help me with this. I think it needs scripting or is there any other way ?
Please help me
My first thought is that you need to figure out what is being passed thru the expression when None is selected, which you can do by using this method — https://www.bigmountainanalytics.com/troubleshooting-custom-expressions-in-spotfire/. Then, you’ll need to modify your expression based on that.
Pingback: Using Label Property Controls in Spotfire » The Analytics Corner
Hi Julie,
I’ve just found the blog, very helpful. I was wondering if it’s possible to return a max value from a (filtered) column as a document property?
I was hoping to use the max value from one column of filtered data to set the max value for a colour in another.
Hopefully that make sense.
Regards,
Max
The way to do that is to create a calculated value and then use JavaScript to send it to a document property. I used to have an example of this but I’m not sure where it is now. Best I can do is this right now — https://community.tibco.com/questions/javascript-get-value-document-property-or-calculated-value-not-working