
Welcome to part 7 of my Spotfire Data Limiting Series. The first post in the covered data limiting with the filter and data panels. The second post talked about data limiting in the web player. The third post discussed limiting using filtering schemes. Then, I covered limiting with marking, limiting with expressions, and limiting with subsets. This is the final post in the series discussing data limiting with rules.
Data limiting with rules is my go-to data limiting method for exceptions reports and Spotfire analysis that QAQC data. I can show only what I want a user to see and hide everything else.
I’ll begin this post with a brief explanation of data limiting with rules. Then, I’ll show you how to set them up. Finally, I’ll explain when to use them and when not to.
What is Data Limiting with Rules?
Data limiting with rules apply to individual visualizations just like limiting with expressions or subsets. The rules can be boolean arguments, simple operators, or complex expressions. While they don’t rely on user interaction, they still give visualizations a dynamic element because they update with changes to the data.
In many cases, they do the exact same thing as limiting with expressions. The difference is that with rules, you can configure rules to show data based on a condition OR hide data based on a condition. Limiting with rules can also be more flexible than limiting with expressions. If you are trying to limit with expressions and run into difficulty, give rules a try.
Setup
To create rules, go to the Properties of a visualization, go to the Show/Hide Items menu and click the Add button.
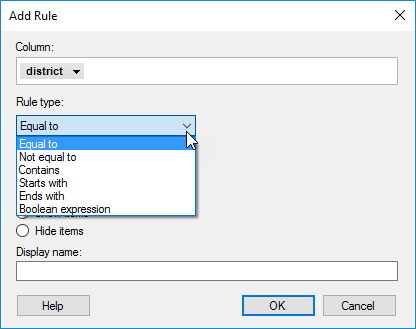
As you can see in the screenshot below, the first step is to select the column that the rules should be applied to. Then, select the type of rule.
To demonstrate the concept, here are two examples of limiting with rules.
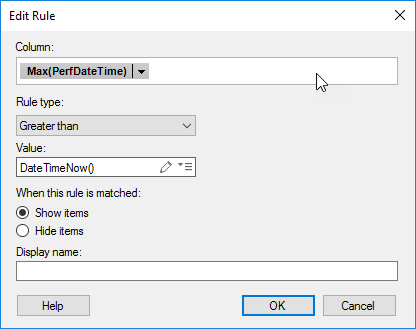
I use this example in a data QAQC project. I am flagging instances where people have hand entered future dates. Perfs can’t occur in the future, and that is bad data to be corrected.
In this example, I am using the result of an expression rather than a column of data to create a rule. If the result of that expression is “FLAG”, then show the items.
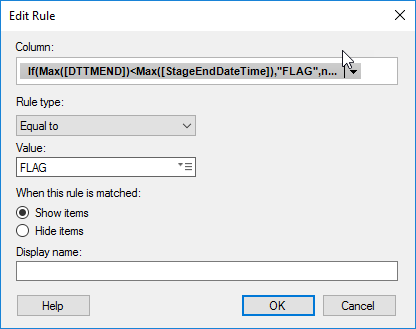
In this case, I needed to create a calculation to flag the data, but I only needed it for this purpose. Therefore, I chose to write the calculation in the rule rather than add the calculation to my overall data table. This helps keep data tables smaller.
Next, let’s talk about when to use rules and when not to.
When to Use
- For exceptions reports, such as QAQCing data.
- When interactivity is not required, and the rules don’t change OR if the rules do change, those changes can be incorporated into property controls.
- When users don’t know much about Spotfire.
When Not to Use
- If you don’t know the rules yet.
- If the rules are going to change frequently and you can’t incorporate potential changes into property controls.
- When users will want to see the “exceptions” data and all other data (in this case use subsets).
In summary, rules are one of my favorite ways to limit data in Spotfire. I use them in all of my analysis files that QAQC data.
Series Summary
Before closing out, I just want to recap all the data limiting methods discussed in the series.
Considerations for Any Analysis
Before you dive into building a DXP with specific data limiting methods, make sure you know the following:
- Skills — Knowledge and ability of the users who will work with the DXP.
- Access — Where the users will access the analysis — desktop client or web player.
- Interactivity — Whether users will need or want to interact with the analysis or whether all content should be presented to them.
- Permanence — Have some idea of how much the analysis could possibly change or need to change.
- Real Estate — Will adding text areas and/or opening panels take up too much space.
Summary for Choosing Your Methods
- Generally speaking, if you want users to be involved in data limiting, let them use the data panel, the filter panel, or set up filters in text areas.
- When you want them to be able to drill up, down or sideways in data (i.e. ask and answer commonly asked questions), use limiting with marking or subsets.
- If you don’t want users to be involved in data limiting, use limiting with expressions or rules.
- Stay away from filtering schemes IF you are worried about user filtering influencing the analysis UNLESS you have specifically configured the analysis to account for this.
Conclusion
Well, that concludes the series. I hope you feel better able to choose among Spotfire’s many data limiting methods. I’m going to return to IronPython posts for a few weeks, and after that, I’ll begin a series on property controls. Stay tuned!
Spotfire Version
Content created with Spotfire 10.2.
Pingback: Data Limiting In Spotfire • The Analytics Corner
Thank you for this series Julie. Nicely done.
Would be interested in your thoughts around using Bookmarks to control filters and alternatives to them.
I think bookmarks are a great tool to control filters when you have more than one user group working in a DXP that needs different filters. Maybe your management team only needs 1 or two but those digging into the details need more. Bookmarks are a great option. With that said, I don’t use bookmarks a whole lot because I get tired of constantly updating them. I find my analysis change quite a lot.