In last week’s post, I showed you how to populate type curve inputs with IronPython and toggle between different sets of inputs. This week, I’ll go one step further using an R function to select type curve inputs from a table and then load them into document properties. Read on to find out how.
The Use Case
As mentioned in the first post, these two solutions came from a brainstorming session between myself and my coworker, David Peach. I also had a little bit of help from TIBCO on this second solution. Davis is building a type curve project right now. His users are working with several sets of type curve parameters, and they have two key requirements. First, they need to toggle between them easily without hand keying them over and over. Second, they want to be able to update or select the type curve inputs easily.
Last week’s post addressed the first requirement of being able to toggle between them easily. However, that solution stored the type curve inputs in the IronPython code, which doesn’t meet the second requirement of being easy to update. This week’s solution will meet that requirement.
Sometimes, I like to begin with the end in mind, so here’s a quick video to demonstrate what the final solution will look like.
Final Solution to Select Type Curve Inputs
Now that you understand what we are building, I’ll provide the high-level steps, a code snippet, and finally, the detailed steps.
High-Level Steps
- Add the type curve table to the DXP (loaded from Excel or your clipboard).
- Add a text area.
- Create the drop-down property control that will be used to select the row in the data table.
- Create all the label property controls.
- Add the data function (script, input parameters, and output parameters).
- Run the script.
- Map the parameters to your data.
Code Snippet
Here is what the R code looks like in the data function.
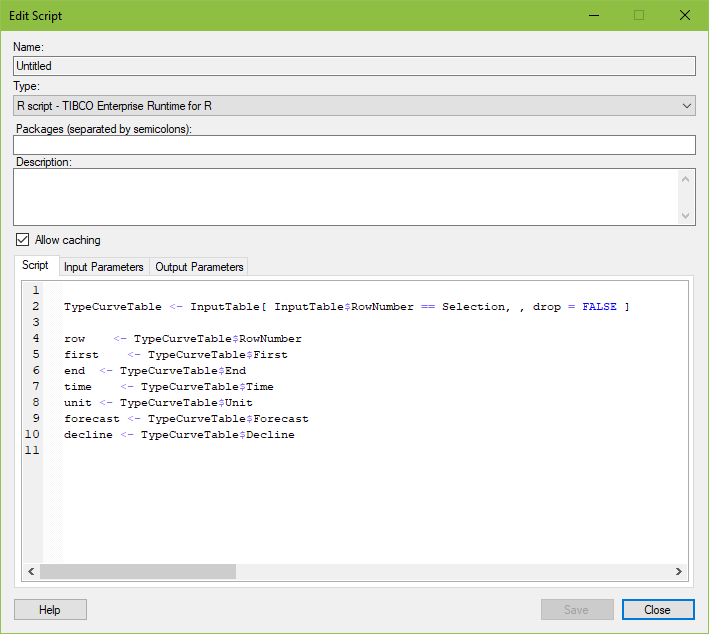
And, here’s something you can copy and paste.
TypeCurveTable <- InputTable[ InputTable$RowNumber == Selection, , drop = FALSE ]

row    <- TypeCurveTable$RowNumber
first    <- TypeCurveTable$First
end  <- TypeCurveTable$End
time    <- TypeCurveTable$Time
unit <- TypeCurveTable$Unit
forecast <- TypeCurveTable$Forecast
decline <- TypeCurveTable$Decline
Detailed Steps
Now, I’ll go through the details steps including screenshots of all my parameters and document properties to make sure you know how they are linked together.
Add the Type Curve Table
- Add your type curve inputs table to the DXP. It will probably be sourced from your clipboard or from Excel. NOTE: You must have a column in this table called “RowNumber”.
Add the Property Controls
- Add a text area to a new page.
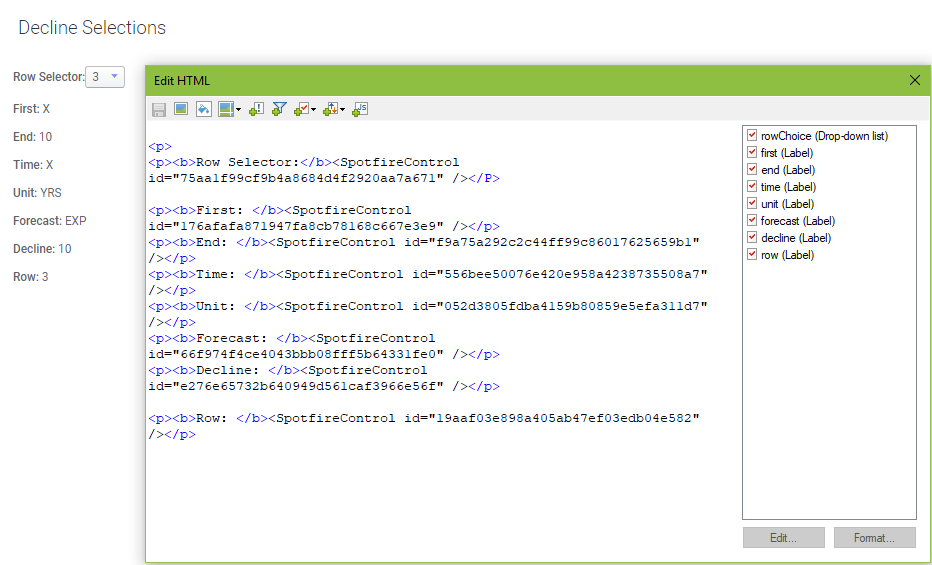
- Right-click the text area and select Edit HTML.
- Click the add property control button and select the drop-down property control.
- Click the New button to create a new drop-down. Name it “rowChoice” and set the data type to String. Don’t enter a value. Click OK.
- Under Set property value through: choose Unique values in column. Set the data table to your type curve inputs table. Set the column to RowNumber.
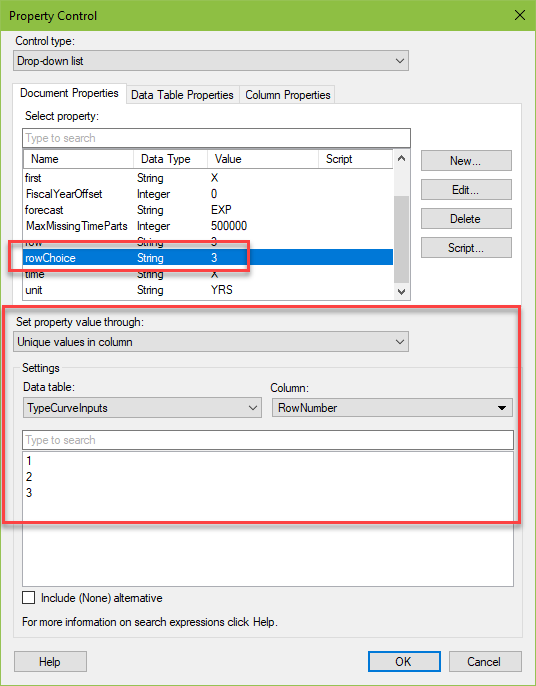
- Click OK to exit.
- Press the add property control button and select the label property control.
- Click the New button to create a label. Name it and set the data type as desired. In my example, the data type was a string. Enter any value. Click OK.
- Click OK to exit and repeat these steps for each label property control. My example includes 7 label property controls named — “first”, “end”, “time”, “unit”, “forecast”, “decline”, and “row”. Yours may be different. NOTE: Input properties must be created one at a time. You may click New again and create another one, but when you go back to the text area, you will find only one input.
Add Data Function
- Go to the Data menu and select Data Function Properties. Click Register New.
- Name your data function.
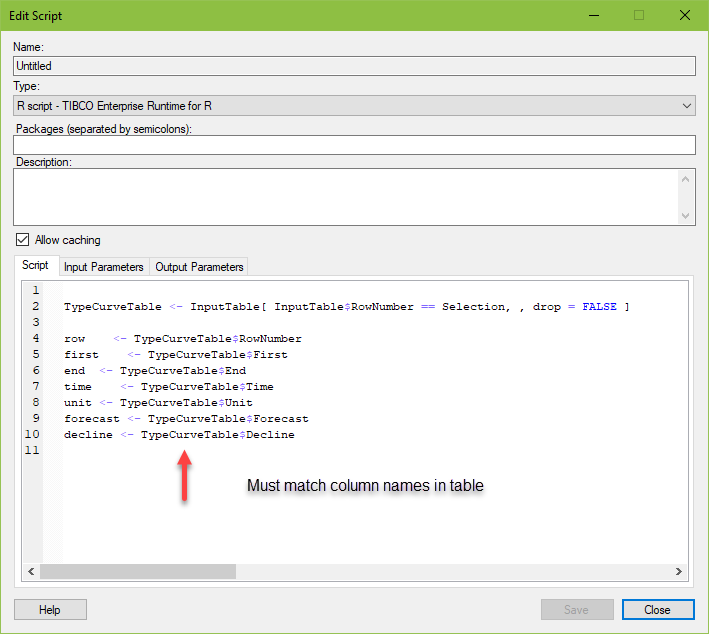
- Copy and paste the script from this post.
- Make sure the column names match what is in your DXP.
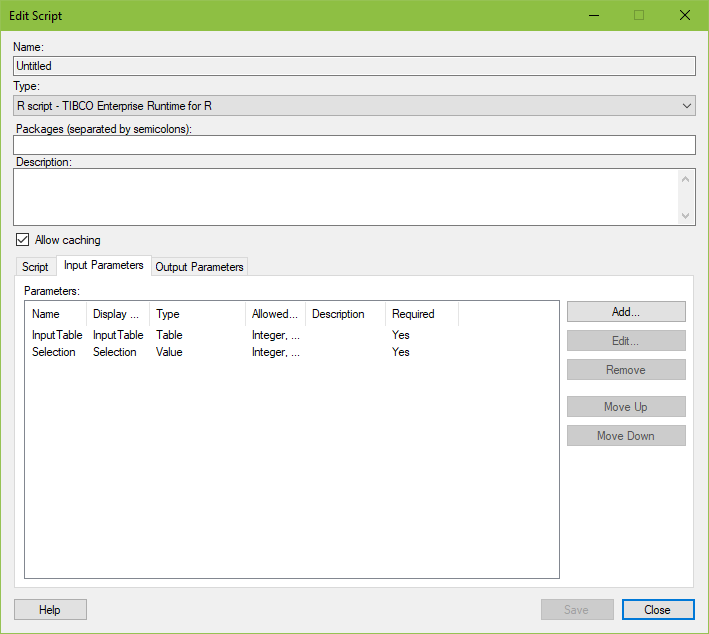
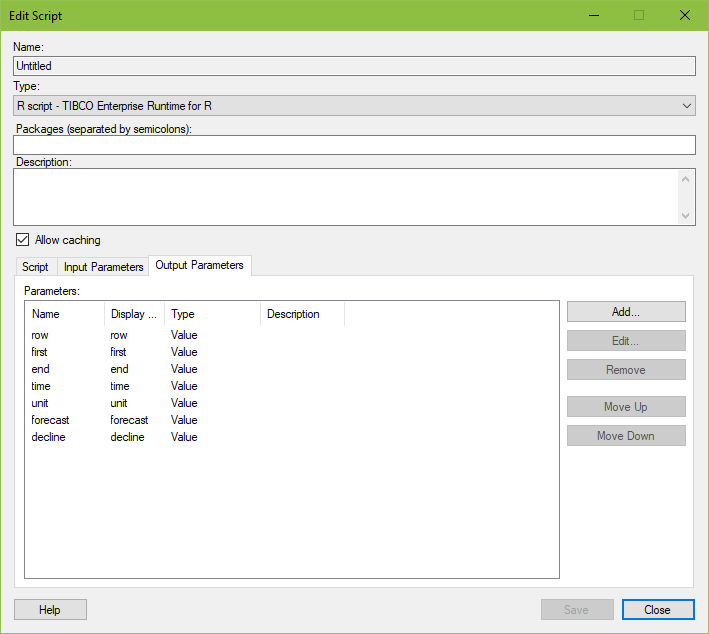
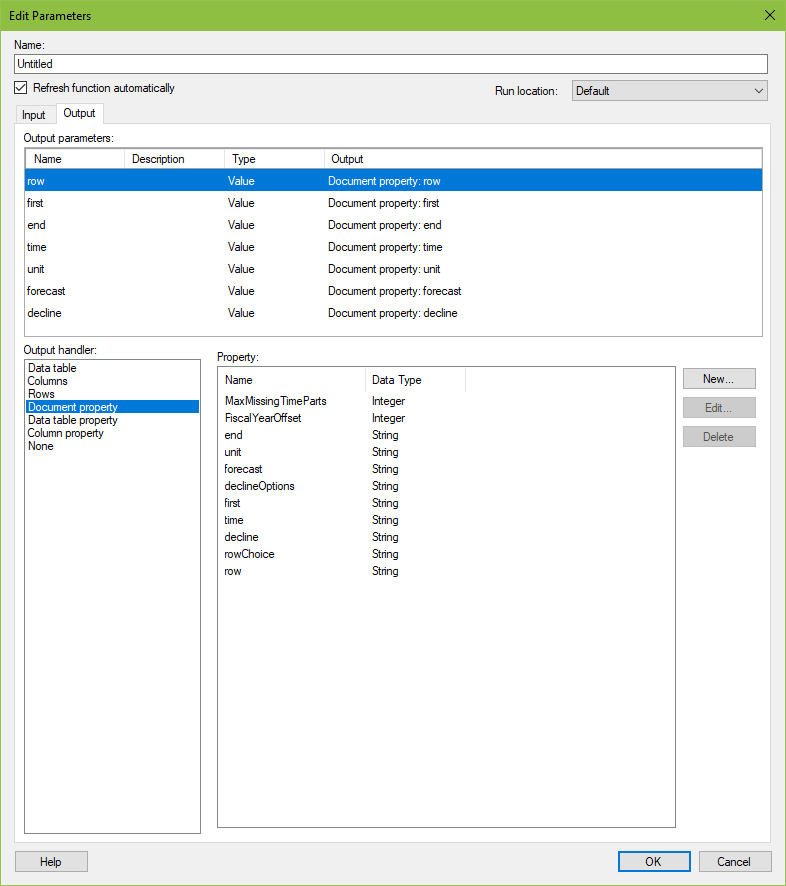
- Add input and output parameters. For simplicity, I have named my output parameters the same as the label property controls.
- Click the Run button to run the data function, which triggers mapping the parameters to the content in the DXP.
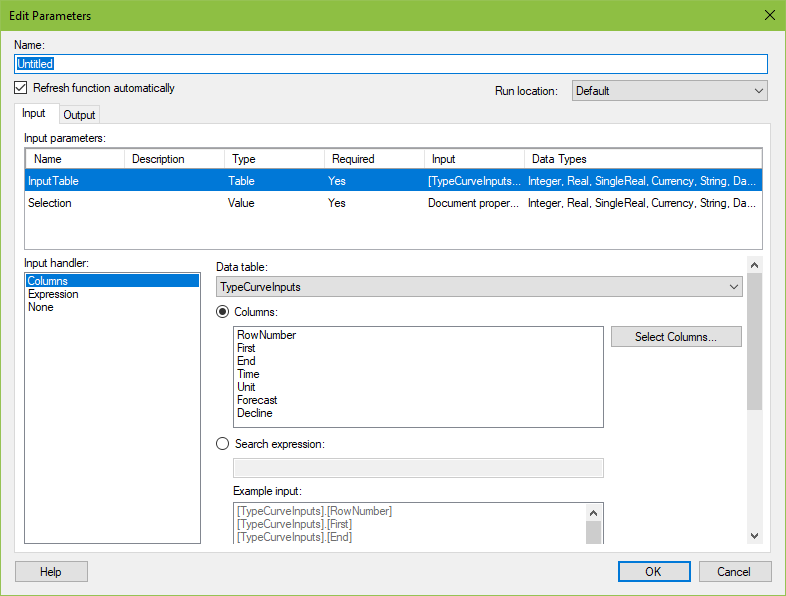
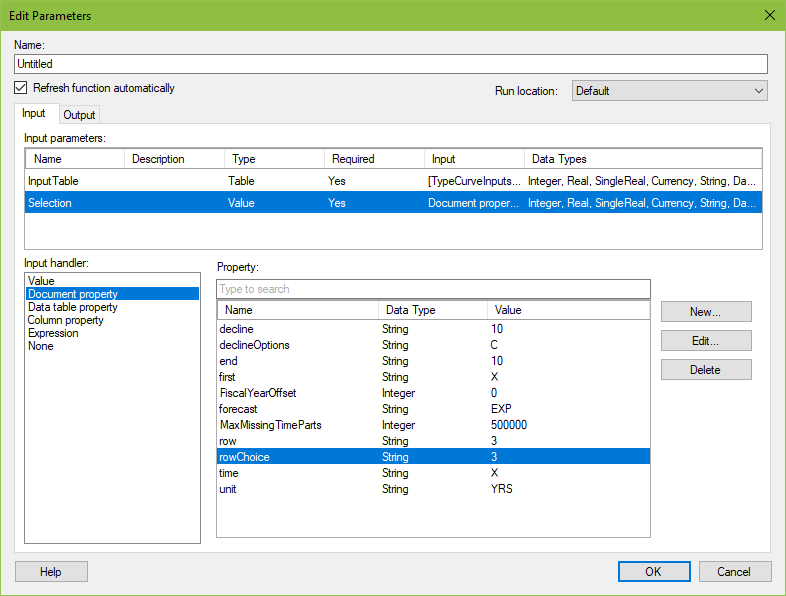
- Map the parameters to the table and document properties as shown here. Make sure to select the correct input handler as shown.
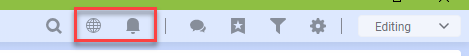
And that’s it! Just make sure you don’t see any errors in the toolbar in the top right-hand corner of the screen. Now you should be able to change the drop-down and automatically populate the document properties which can then be used to build type curves. This is a much cleaner solution than having to constantly update the property controls manually.
Spotfire Version
Content created with Spotfire 10.2.
Coming Next Week
Next week, I’ll post about how to export to Excel using IronPython. It sounds easy, but a different solution is required in the web player versus the desktop.
If You Enjoyed This, Check Out…
…some of my other IronPython postings.
I need to get the power curve in scatter plot and be able to change the constant . How can I do that?
If that can be done, it will be with IronPython. I poked around at the API and didn’t see anything that would represent the constant that you want to change. It’s not even an option in the PC config, so I kinda doubt it’s possible but am happy to be wrong.