When I was writing for Ruths.ai, I authored a few posts on Spotfire’s Bookmarks, Tags, and Lists functions. I touched on bookmarks, but not bookmark specials. The bookmark special functions allow users to apply one or more parts of what is captured in a full bookmark. They are an underutilized feature that can perform a wide variety of tasks. Users can rearrange visualizations using bookmarks, specifically bookmark special that captures only the layout.
This week, someone posted a question in the Differences Between Bookmarks, Tags and Lists comments section. They asked…
Just wondering if you know if it’s possible to rearrange the page using bookmarks but remove some visualizations or hide them completely off the page?
The answer is yes, you can! And, you can do it with bookmark special. This week I’ll answer that question in detail showing you how to use bookmark specials to remove or hide visualizations. To get started, let’s talk about bookmarks.
Bookmarks
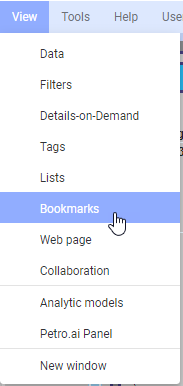
Bookmarks are a great Spotfire feature that allows users to recall one or more parts of an analysis. Users create bookmarks using the bookmarks panel. In Spotfire 10 or higher, turn on the bookmarks panel by going into the View menu as shown below.
Then, click on the pin to dock the panel to the left side of the page.
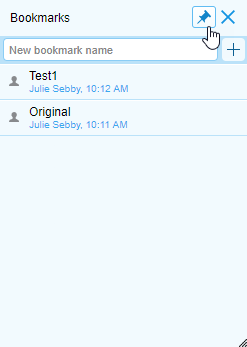
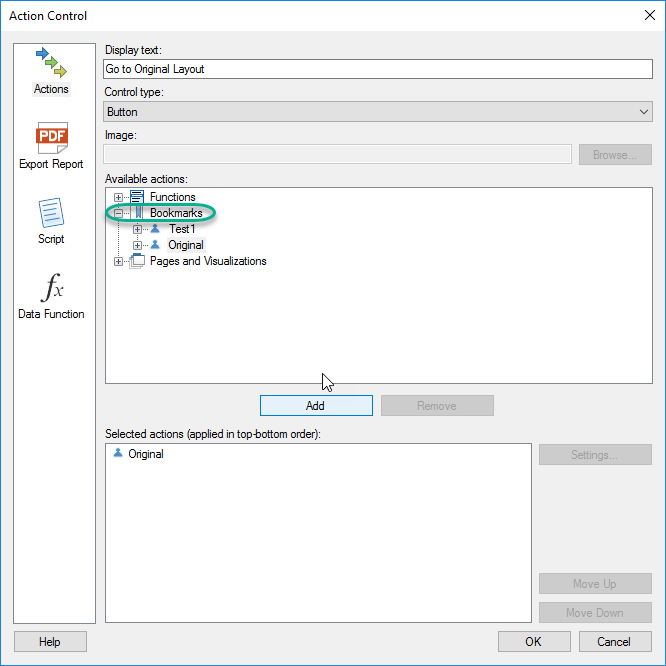
Users create basic bookmarks by getting the analysis to the desired state, entering a bookmark name in the text box shown, and clicking the plus sign. The bookmark will then appear in a list in the bookmarks panel. Users return to that state of the analysis by double-clicking on the bookmark OR the bookmark can be attached to a button in a text area as shown below.
Now, to get directly to this user’s question, let’s talk about bookmark special.
Bookmark Special
When a user creates a bookmark, Spotfire captures 7 different parts of the analysis. To see what is captured, open the bookmarks panel, right-click on the plus sign, and select Add Bookmark Special.
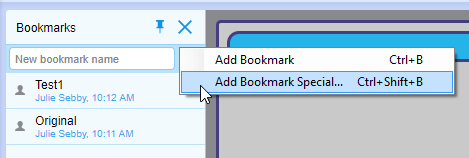
Now, you can see exactly what the bookmark is capturing.
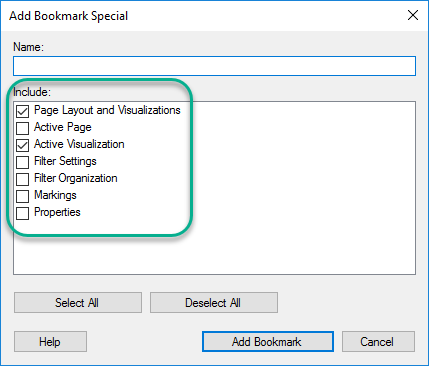
You can also see that each “capture” is optional. Thus, you can create bookmarks that pick up one or more pieces, which is what we will do to answer this user’s question.
Creating a Bookmark Special to Organize Visualizations
Now, I am going to follow the steps shown below in order to create a several “special” bookmark to minimize and maximize visualization to show/hide them. The steps are listed below, and I have also created a video.
Detailed Steps
- Create an “original” layout with all of the visualizations organized on a page.
- Open the bookmarks panel and click on the pin to dock it to the left-hand side of the screen.
- Right-click on the plus sign and select Add Bookmark Special.
- Click the Uncheck All button. Then, select only Page Layout and Visualizations and Active Visualizations.
- Name this one “Original Layout” and click Add Bookmark.
- Go to one of the visualizations and click the Maximize Visualization button in the toolbar.
- Right-click on the plus sign in the bookmarks panel and select Add Bookmark Special.
- The options should default to your last selections. Thus, you should only need to name the bookmark and click Add Bookmark.
- Click your Original Layout bookmark to get back to the original layout.
- Repeat these steps for each of the visualizations.
Now, you can use the bookmarks panel to minimize and maximize visualizations as needed. This is better than using the maximize button in the toolbar because you can control the order in which visualizations are presented.
If you prefer video, here’s a video of the same steps.
Another Layout Option
The only downside to this method is you can only minimize and maximize one visualization at a time. My preference is to show one maximized visualization and a text area with buttons to click to minimize and maximize other visualizations. Here is an example of that type of layout.
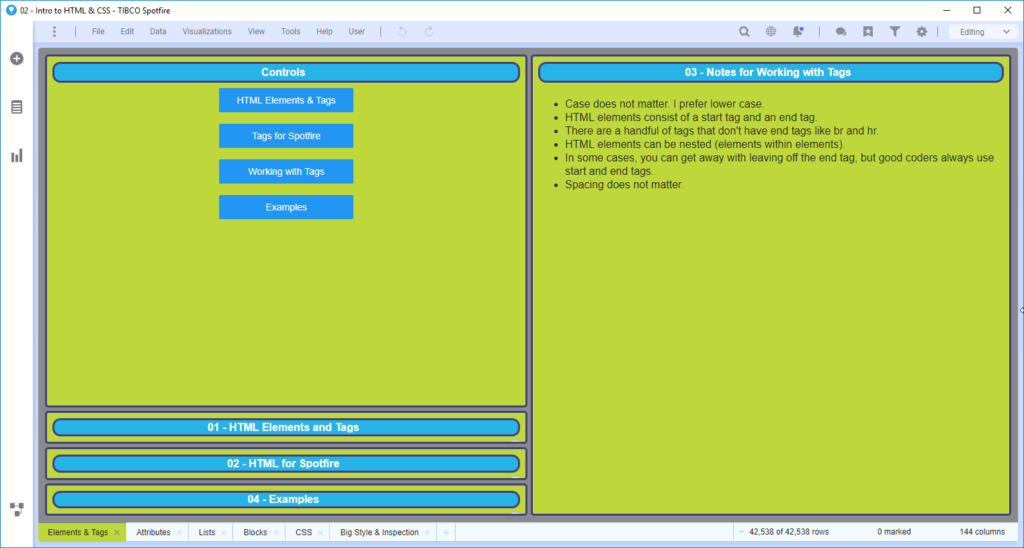
As you can see, I have made the “minimized” visualizations as small as possible. My “maximized” visualization is on the right. I have a text area on the left with bookmarks attached to buttons to toggle between the visualizations. This is another option that would be created in the same way as described above. Just make the visualization small and narrow. Perhaps, even hide the title bar.
That concludes this weeks post on rearranging visualizations using bookmarks. Now you know how to use bookmark specials to organize your DXP pages.
Spotfire Version
Content created with Spotfire 10.2.
Pingback: Apply Relations and Column Matches in Spotfire » The Analytics Corner
Pingback: Part 3 - Spotfire Data Limiting with Filtering Schemes » The Analytics Corner
Julie — always enjoy your great posts!
Unfortunately I was doing exactly what you outlined but found that bookmarks fall down when a team of developers is working on one template. Unfortunately UserA cannot refresh a public bookmark created by UserB — either explicitly or through IronPython.
Mark
Mark, thanks for the comment. When you say fall down, what do you mean exactly? And when you say refresh a public bookmark, do you mean change a public bookmark?
Pingback: How to Use Relations in Spotfire » The Analytics Corner