A few weeks ago, a user reached out with a question regarding an IronPython script he was using to change the formatting on visualizations. I’ve never used IronPython for this purpose, but it was fun to learn how to format visualizations with IronPython in Spotfire. And, I wanted to share. Read on to learn more.
The script we are using originates from this article on Community. The original script is much longer and includes some additional functionality you might be interested in, like setting the number of decimal places. Definitely check it out. The script is designed to be attached to a drop-down property control. The user selects an option in a drop down, and the formatting in a bar chart changes based on the selection. You can see this in action further below.
Code in Spotfire
Code for Copy and Paste
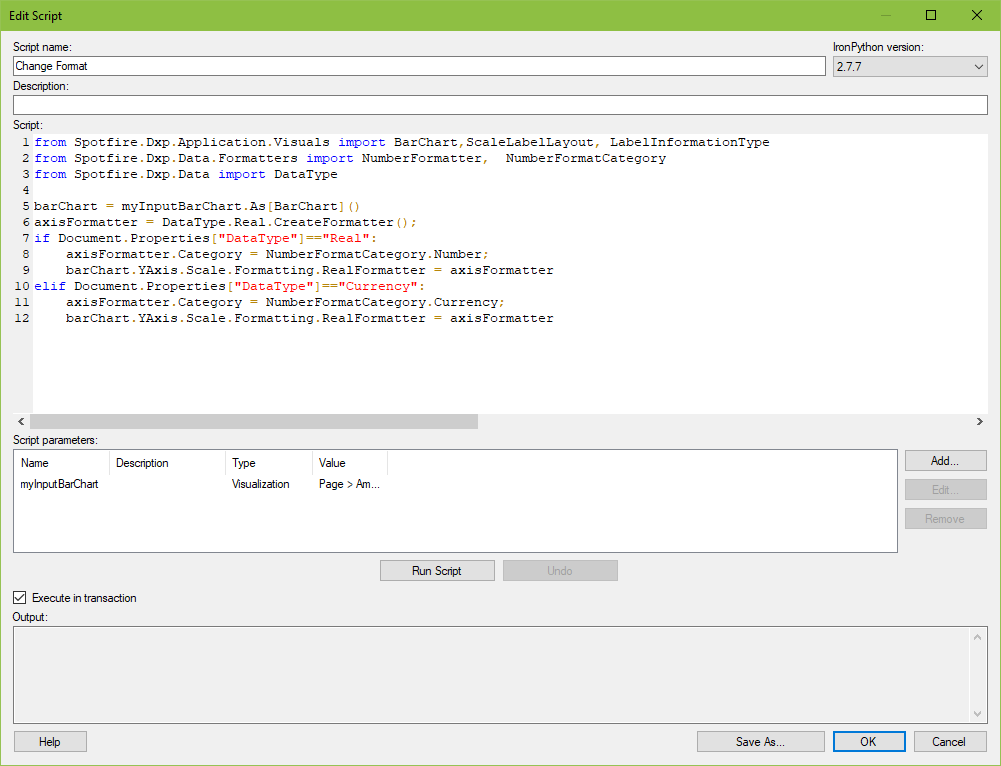
Copy and paste the code below into your own project. You might need to redo the spaces in lines 8,9, 11, and12 (line numbrs shown in screenshot above). I had issues in my first go-round when copying from a website.
from Spotfire.Dxp.Application.Visuals import BarChart,ScaleLabelLayout, LabelInformationType
from Spotfire.Dxp.Data.Formatters import NumberFormatter,  NumberFormatCategory
from Spotfire.Dxp.Data import DataType

barChart = myInputBarChart.As[BarChart]()
axisFormatter = DataType.Real.CreateFormatter();
if Document.Properties["DataType"]=="Real":
	axisFormatter.Category = NumberFormatCategory.Number;
	barChart.YAxis.Scale.Formatting.RealFormatter = axisFormatter
elif Document.Properties["DataType"]=="Currency":
	axisFormatter.Category = NumberFormatCategory.Currency;
	barChart.YAxis.Scale.Formatting.RealFormatter = axisFormatter
Modifications to Make
- Update the name of the property control. I named my property control “Data Type”. Replace the 2 instances of “Data Type” with the name of your property control.
- Update the drop down values. I named my drop-down values “Currency” and “Real”. Replace these with your drop down options.
- If you have more than 2 drop down options, you’ll need to expand the “else” part of the script.
- Change the visualization type from BarChart to whatever visuailzation type you are using. This means updating what’s called in line 1 from BarChart to a different visualization type. You’ll then need to update line 5. Note, “barChart” is an object. BarChart is the IronPython syntax. I recommend updating both for clarity.
- Lastly, you must add a parameter to connect your visualization to the script.
How It Works
Hit play below to run this animated GIF that demonstrates how the drop-down property control triggers the script, which updates the visualization.
If you are unfamiliar with how to create and attach IronPython scripts to property controls, check out any of the links below for detailed steps. Now you know how to format visualizations with IronPython in Spotfire.
Thank you for this informative blog.
Does ironpython work with an external database using Oracle direct connection?
I tried reading from a table using IronPython DataValueCursor, but it doesn’t work with an external dataset. is this an issue with the external dataset or the script, even though I’ve tested the script with a local dataset and it works.
You need to bring the data into Spotfire. There is an option for that when you are configuring the connection. It isn’t the default, and you can’t change it once the connection is setup. You have to redo the connection.
IronPython should work with any data source as long as you bring the data into memory. When you bring data in with a data connection, the default is to keep the data External, not to bring the data into memory. You have to change that setting.