This is the fourth post in my series on learning the Spotfire expression language. Last week, I talked about the over keyword and how it is used to group values in calculations. The next step in the learning process is using node navigation. Once this is second nature, you will be able to create any calculation desired. This week’s post focuses on understanding what node navigation is for and what a node is. Next week, I’ll add complexity and depth to the expressions. Read on to learn more.
What is Node Navigation?
Spotfire is different from Excel in that Spotfire calculates down columns, rather than down and across cells. For example, the calculation below will return a single number that repeats in each cell. Over, Intersect, and Node Navigation is how users navigate this seemingly rigid structure for calculation.
Avg([Gas Prod])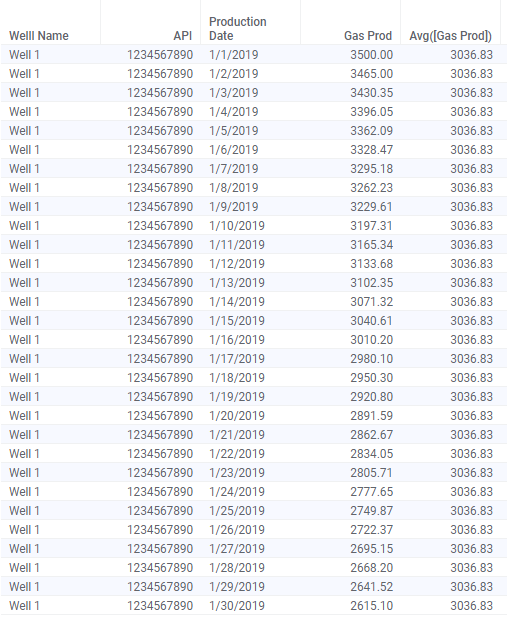
To be able to calculate with more specificity, the over keyword is used to group data in calculations. Over can be read as “for each”. For example, the calculation below will calculate the average gas production for each well. With this calculation, you will still see repeating values, but the number will change for each Well Name.
Avg([Gas Prod]) over [Well Name]Node navigation comes into play when you want to direct the calculation to a specific record or group of records. For example, the calculation below will return the Gas Prod for the previous ProdDate. Now, this is where it starts to get a little tricky. In the expression below, you don’t read over as “for each”. But, it is still required syntax in order to use the Previous method. I’ll explain this in more detail in next month’s post. For right now, focus on what node navigation is used for.
Sum([Gas Prod]) over (Previous([Production Date])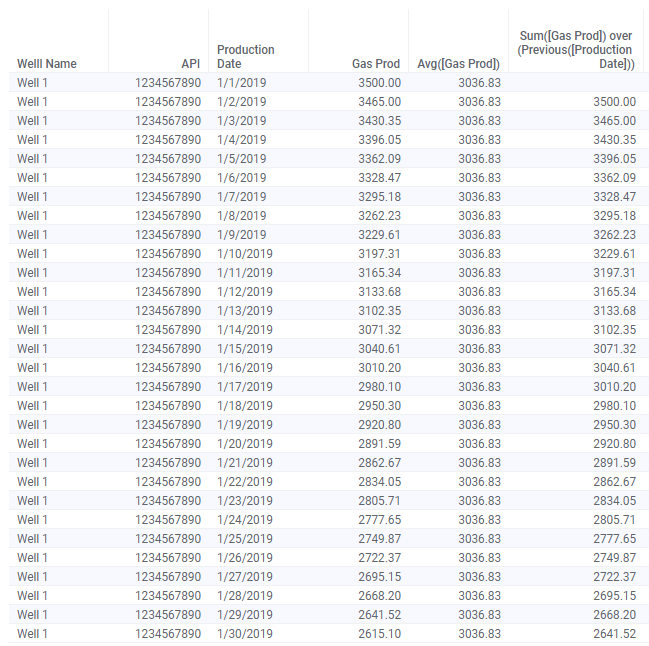
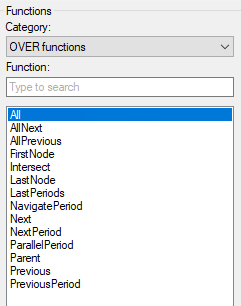
Node navigation methods are part of the OVER category of function in the Add calculated column dialog.
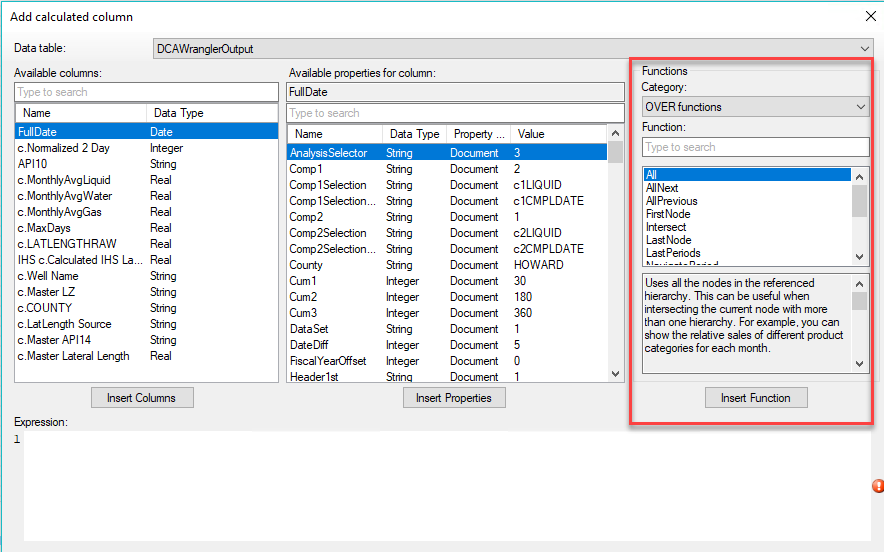
Here is a complete list of all node navigation methods.
To use them, you need to understand what a node is. So, let’s talk about what a node is.
What is Node?
When I started working with Spotfire expression, I didn’t understand what a node was. TIBCO documentation didn’t explain it, and understanding the concept of a node is critical to learning how to use node navigation. Now, defining a node will look a little different if you are inserting calculated columns into a table or writing an expression on the axis of a visualization, but the concept is the same for both. Let’s dig deeper with 2 examples.
We’ll start with this simple data set containing gas production for a single well.
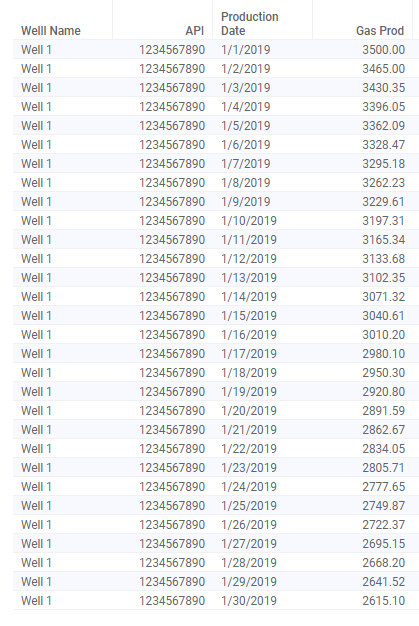
Let’s say I want to calculate the difference in gas production from day to day. In other words, what is the difference in gas production from 1/1/2019 to 1/2/2019? How do I write a calculation to look at the next record or previous record and subtract the difference?
I will use the Previous method with the Production Date column since I want to navigate between dates. Here is the expression.
c.Delta = Sum([Gas Prod]) over (Previous([Production Date])) - [Gas Prod]The first part of the expression finds the previous day’s production. The second part of the expression references the current record. Also, an aggregation method is required. Spotfire produces an error if you try to use over and node navigation without an aggregation method (sum, avg, etc).
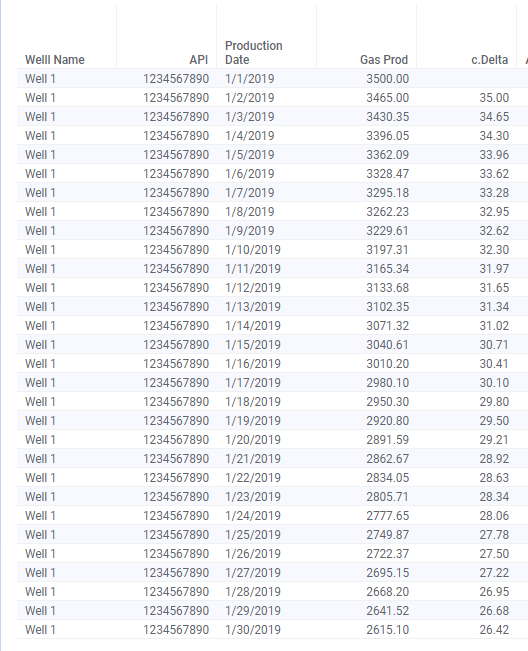
The original question was — What is a node? The nodes are the unique values in the Production Date column. Spotfire will navigate thru the nodes or values of the Production Date column. Thus 1/1/2019 is a node and so is 1/2/2019.
Node Navigation with Axis Names
For my second example, I will put the same data into a bar chart and use the expression shown below to navigate.
Sum([Gas Prod]) over (Previous([Axis.X])) - Sum([Gas Prod])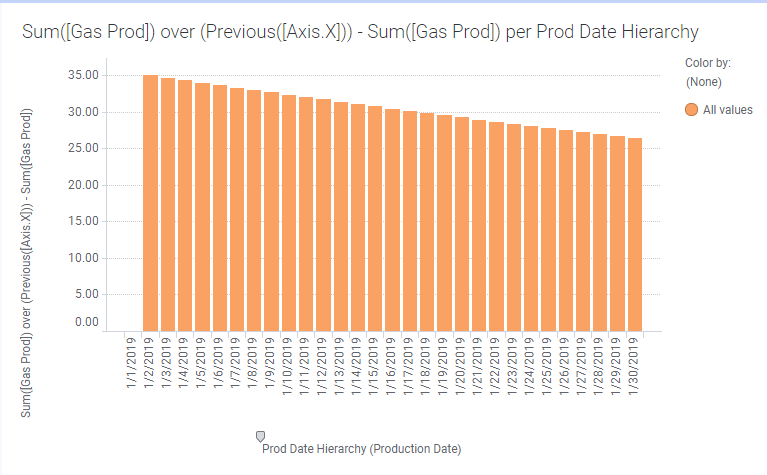
Instead of referencing the Production Date in the expression, I used [Axis.X]. Axis.X is one of many Axis Names available when writing expressions on the axis of a visualization. Because Production Date is on the x-axis that is what [Axis.X] is using in the calculation. Because I am referencing Axis.X, I can change the column of data on the x-axis and the calculation will adjust and update. This makes it very flexible. Note, Axis.X is wrapped in square brackets the same as column names. Additionally, writing the expression on the axis of the visualization means the calculation will take filtering into account.
NOTE: With bar charts, you must put a hierarchy on the x-axis, even if it is a one-level hierarchy as shown here. Without the hierarchy, you’ll get an error saying it couldn’t find axis X.
Rules for Using Node Navigation
Before wrapping up, I want to summarize a few of the rules for mentioned above.
- Over can be used without node navigation, but node navigation cannot be used without over.
- Measures must be aggregated when using over AND node navigation.
- When writing expressions on a bar chart, the x-axis must be a hierarchy.
Wrap Up
Writing basic expressions using node navigation should be a breeze now. However, I haven’t shown you all you need to know. Next week, I’ll incorporate the intersect keyword, and we’ll explore different node navigation methods. There is also a lot more content coming up on Axis Names.
Spotfire Version
Content created with Spotfire 10.2.
Pingback: Using the Intersect Keyword » The Analytics Corner
Pingback: Node Navigation - All, Next, Previous, AllNext & AllPrevious » The Analytics Corner
Pingback: Using the Then Keyword » The Analytics Corner
Pingback: Spotfire Errors Querying Two MS Access Tables » The Analytics Corner
Pingback: Master NavigatePeriod Node Navigation » The Analytics Corner
Pingback: Use the Over Keyword » The Analytics Corner
Pingback: Node Navigation - Parent & ParallelPeriod » The Analytics Corner
Hi Julie,
Can i get the dataset for this.
I don’t think I have it anymore. I frequently build dummy data sets on the fly.
Pingback: Limiting Data When Columns Change » The Analytics Corner
Pingback: Why Do Counts Aggregate Differently in Spotfire? » The Analytics Corner
How does the data know whether a node is “previous” to another node or not? Using your example, is the fact that (Previous([Production Date]) pulls the prior date due to the fact that the nodes are of date/time data type or is it tabular, in the sense that your data was sorted top to bottom from earliest date to latest date?
In other words, how would (Previous([Production Date]) have been affected if your data table wasn’t sorted by production date top to bottom? Or if the Previous function was ran on a completely different type of data (i.e. numbers, category, etc.)?
It’s because Previous is DateTime. If I didn’t have a date time field and had a categorical field, I believe the previous would be dictated by the sort order.