Since launching the Analytics Corner, I’ve focused heavily on IronPython with a dash of Alteryx. I’ve started working more with Axis Names recently, which was a reminder of how nonintuitive they are. Because I haven’t written much on Spotfire expressions since starting the Analytics Corner, I’m going to do a comprehensive series on how to learn the Spotfire expression language, which will include a good section on Axis Names.
Today’s first post will be a short summary of the different ways to write expressions in Spotfire. Next week, I’ll talk about the over keyword. Then, I’ll cover node navigation, which might take more than one post. I will also show you how to use important functions like $esc and $map. Finally, I’ll close out with a few posts on Axis Names. Read on to get started.
Calculations in Spotfire
Depending on how you look at it, there are 2 – 3 ways to write calculations in Spotfire.
- Insert a calculated column into a data table.*
- Using a transformation.
- Using the Add Calculated Column option in the Data menu.
- Write an expression on the axis of a visualization.
*Both 1 and 2 will insert a calculation into a data table.
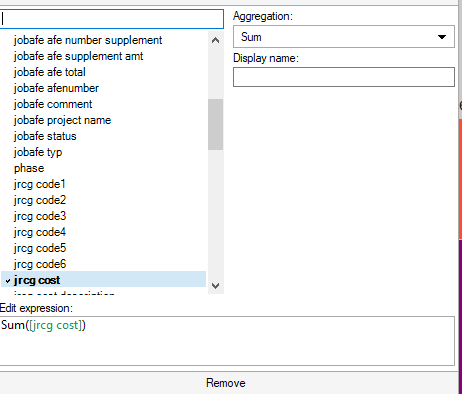
It’s very easy to write simple expressions on the axis as shown below. However, writing more complex expressions can quickly become frustrating.
Thus, most new users default to inserting calculated columns. Although, they will quickly run into limitations.
It used to be the case that if you wanted to use a calculated column in a pivot or unpivot, it had to be added as a transformation. However, that is no longer a restriction, and calculated columns added via the Data menu can be used in pivots and unpivots without limitation.
Thus, 1.1 and 1.2 are only different in terms of the order of operations. 1.1 happens as data is coming into Spotfire and because of that, you may order it with other transformations. For example, you could create a calculated column using a transformation and then change that column’s data type. Or, you could create a calculated column and then filter data out of the data set. Otherwise, 1.1 and 1.2 are the same.
Limitations of Calculated Columns
The biggest limitation of writing calculated columns to a data table is that the calculation result uses all data in the table. In other words, calculated columns do not update or respond to filtering. For example, this calculation will add up all GasProd for each region. However, that number will not change if you filter the date range.
Sum([GasProd]) over [Region]For a long time, I used a pass thru data functions to get around this limitation. However, once you learn how to use Axis Names and write expressions on the axis of a visualization, this becomes unnecessary.
I know that wasn’t much this week, but in the coming weeks you’ll great content to help learn the Spotfire expression language, including Axis Names.
Spotfire Version
Content created with Spotfire 10.2.
Hi Julie, thanks for writing all these articles about Spotfire. I would argue that it is not a limitation of a calculated column, that it is not responding to filtering, it is actually a very valuable functionality and a good distinction between calc columns and custom expressions in an axis of a chart.
There is a third way to use Spotfire‘s expression language: calculated columns as a transformation during data loading. It also creates a calculated column, but it is fix (aka frozen) so you can use it in other transformations e.g. unpivots. All three are following the exact same expression language and are part of one single software tool, so whatever you‘d like to achieve with your calculation, you only have to learn one syntax. And if you need even more, you can even use an inline TERR function as part of your expression as well…
I definitely understand why Spotfire calculated columns are designed the way they are. However, I have yet to meet an engineer that thinks having calculations not respond to filtering is a feature rather than a bug. 🙂 You are right that adding a calculated column as a transformation is another way of using the expression language. I’ll update to reflect that. Thanks for the comment.
I just updated the post.
Pingback: How to Use Axis Names in Spotfire Cross Tables » The Analytics Corner
Christof,
I was looking at this a bit closer. It used to be the case that if you wanted to use a calculated column in a pivot or an unpivot, it had to be created with a transformation. That is no longer a limitation, so I’m not sure it’s frozen anymore.
Pingback: Use the Over Keyword to Slice and Dice Spotfire Calculations » The Analytics Corner
Pingback: Using Node Navigation in Spotfire » The Analytics Corner
Pingback: Using the Then Keyword » The Analytics Corner
Pingback: Node Navigation - All, Next, Previous, AllNext & AllPrevious » The Analytics Corner
Pingback: Spotfire Errors Querying Two MS Access Tables » The Analytics Corner
Pingback: Node Navigation - FirstNode, LastNode, LastPeriods, PreviousPeriod & NextPeriod » The Analytics Corner
Pingback: Node Navigation - Parent & ParallelPeriod » The Analytics Corner
Pingback: Master NavigatePeriod Node Navigation » The Analytics Corner
Pingback: Using the Intersect Keyword » The Analytics Corner
Hi Julie, thanks for writing these great articles. I learn something new every time I read one :).
I’ve know about the way filtering affects calculated columns, but never thought of suggesting to users to use Axis expressions instead when you want the values to filter. I typically use calculated columns or the transform depending on how I want things to update, and where in my data prep flow I want the calculation to take place (more on this toward the end of this vid: https://youtu.be/dO8-c5Str4U). Transforms can be used wherever, but Add Calculated Column always lands on the far right node in the Data Canvas (i.e. The final data table). Similarly for pivot/Unpivot transforms vs using Unpivot from the Data Panel.
Also, maybe helpful, I recently learned from Spotfire engineering that:
1) calculated columns vs Axis expressions use same memory. If Calc is reused, often useful to use calculated columns instead of expressions, but just for convenience. Resources used would be the same.
2) all transformations run as the DXP is loading, so calculated columns require a Data Table refresh to update with any document properties.
I’ve found it a bit problematic that Add Calculated Columns always land on the far right node. I don’t think people realize that a lot of the time. I’ve never actually used unpivot from the Data Panel, but I believe you if you say it winds up on the far right node. I am sure there is a design reason for it, but small differences like that are confusing to users. Good to know about the memory and transformations. It used to be the case (years ago) that the tables didn’t even update automatically. We sure have come a long way since then.
Pingback: $esc and $map Functions in Spotfire » The Analytics Corner
Pingback: What are Spotfire Axis Names? » The Analytics Corner
Pingback: Spotfire Axis Names on Bar Charts » The Analytics Corner
Pingback: Using Document Properties to Control Data Limiting by Expression » The Analytics Corner
Pingback: Spotfire Axis Names on Line Charts » The Analytics Corner
Pingback: Troubleshooting Custom Expressions in Spotfire » The Analytics Corner
Hi Julie,
I enjoy your education content on Spotfire. I have encountered a situation where I need (or think I need) to setup a calculated column so that the case statement expression looks at a specific column and if the expression matches a specific criteria I get a desired output. In my specific case I have a column of GL accounts and need to write my case statement expression so that it looks at a range of GL accounts and classifies that specific range to a specific output. For example, I am trying to write an expression for the following GL range (10000000 – 60600099) and if GL accounts in the column match this range expression, I want the output to classify as “Non-Opex”.
I could write out my expression as follows:
case
When [CostElement]~=”0010000000″ then “NonCapex”
when [CostElement]~=”0020000000″ then “NonCapex”
else “Capex”
END
but this expression gets labor intensive and not very user friendly for other data scientists to follow. Is there a more elegant way to write this “range” expression and thereby simplify the code. Thanks, Bernardo
Are your GL accounts strings or integers?